
To determine: What happens to private savings, private investment spending and the investment rate in the given scenario.
Concept Introduction:
Closed Economy: It is a type of economy in which there is no external trade that means there is no import and export.
Investment spending: All those spending which are done on physical capital which means that only expenses that increase economy level of physical capital is known as investment spending.
The formula to calculate investment spending is:
Here,
- I is investment spending.
- GDP is
gross domestic product . - C is consumption spending.
- G is government spending.
Private Saving: It is the saving made by people for times of emergency or bad financial conditions in the future.
The formula to calculate private saving is:
Here,
- T is tax revenue.
- GDP is gross domestic product.
- C is consumption spending.
Budget Balance: The budget is considered to be balanced when revenue collected from tax and expenditures made by government are equal. When it is deficit it is represented by a negative value, when it is surplus it is represented by a positive value and in case of balanced budget it is zero.
Loanable Funds Market: It is an imaginary market which illustrates the market result of the demand for funds which are generated by borrowers and supply of funds which are provided by the lenders.
Demand for Loanable Funds: It is represented by a downward sloping curve which shows that as the interest rate increases the demand for such funds decreases and vice versa.
Supply for Loanable Fund: It is represented by the s curve that slopes upward which means that as the interest rate increases the supply of such fund also rises and vice versa.
Explanation of Solution
a. Budget balance is zero.
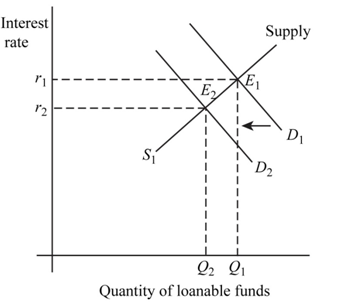
Fig 1
- In the above figure, vertical axis shows interest rate and horizontal axis shows quantity of loanable funds.
 and
and represents demand and supply curve for loanable funds respectively. The intersection of demand and supply curve gives equilibrium point
  where the interest rate is
  and quantity of funds is
- Due to reduction in deficit the demand curve will shift from
 to
to There is no change in supply curve. The new equilibrium is achieved at point
  where the new interest rate is
 and. quantity of fund demanded is
  Hence, interest rate as well as quantity of loanable fund decreases at new level of equilibrium.
 - Due to decrease in interest rate and income, private savings will decrease as the
opportunity cost of saving has decreased. Private investment spending will increase because at lower interest rate people will borrow more to invest.
Conclusion:
Thus, private saving and interest rate decreases and private investment spending increases.
b. Consumers save more.
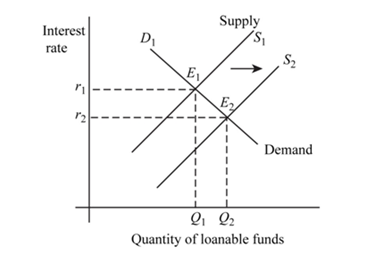
Fig 2
- In the above figure, vertical axis shows interest rate and horizontal axis shows quantity of loanable funds.
 and
and represents demand and supply curve for loanable funds respectively. The intersection of demand and supply curve gives equilibrium point
  where the interest rate is
  and quantity of funds is
- Due to increase in saving by consumer supply curve will shift from
 to
to There is no change in demand curve. The new equilibrium is achieved at point
  where the new interest rate is
 and. quantity of fund demanded is
 Hence, interest rate has decreased and quantity has increased at new level of equilibrium.
 - Due to decrease in interest rate private savings will decrease as the opportunity cost of saving has decreased and due to increase in output income will increase which will induce more saving.
- Hence, savings will increase or decrease, this cannot be concluded. Private investment spending will increase because at lower interest rate people will borrow more to invest.
Conclusion:
Thus, interest rate decreases and private investment spending increases. Private saving may decrease or increase.
c. Businesses become optimistic for future profitability.
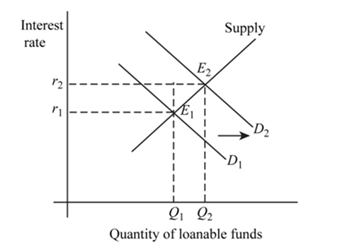
Fig 3
- In the above figure, vertical axis shows interest rate and horizontal axis shows quantity of loanable funds.
 and
and represents demand and supply curve for loanable funds respectively. The intersection of demand and supply curve gives equilibrium point
  where the interest rate is
  and quantity of funds is
- Businesses are optimistic about future profitability which means that the investment will increase. This will lead to rise in demand for loanable fund. As a result the demand curve will shift from
 to
to
- There is no change in supply curve. The new equilibrium is achieved at point
 where the new interest rate is
 Hence, interest rate as well as quantity of loanable fund increases to a new level of equilibrium.
 - Due to an increase in interest rate, income private savings will increase as the opportunity cost of saving has increased. Private investment spending will decrease because at higher interest rate people will borrow less to invest.
Conclusion:
Thus, private saving and interest rate increases and private investment spending decreases.
Want to see more full solutions like this?

- Explain if any states are not a “friendly” place for tax preparers, payday lenders, title pawn lenders, and “credit approved” used car dealers to operate in and what they have done, regulation-wise.arrow_forwardExplain the regulation or lack of regulation of payday lenders, title pawn lenders, and “credit-approved” used car dealers in Alabama.arrow_forwardExplain why people should avoid the business model of payday lenders, title pawn lenders, and “credit approved” used car dealers.arrow_forward
- Explain why people fall prey to payday lenders, title pawn lenders, and “credit-approved” used car dealers.arrow_forwardPlease answer the following.arrow_forwardThe figure below shows the hypothetical domestic supply and demand for baseball caps in the country of Spain. Domestic Supply and Demand for Baseball Caps Price (€ per cap) 10 9 8 7 6 5 4 3 2 1 0 Spain Dd 10 20 30 40 50 60 70 80 90 100 Baseball caps (thousands per month) Suppose that the world price of baseball caps is €2 and there are no import restrictions on this product. Assume that Spanish consumers are indifferent between domestic and imported baseball caps. Instructions: Enter your answers as whole numbers. a. What quantity of baseball caps will domestic suppliers supply to domestic consumers? thousand b. What quantity of baseball caps will be imported? thousand Now suppose a tariff of €1 is levied against each imported baseball cap. c. After the tariff is implemented, what quantity of baseball caps will domestic suppliers supply to domestic consumers? thousand d. After the tariff is implemented, what quantity of baseball caps will be imported? thousandarrow_forward
- May I please have the solutions for the following assignment? as 2025arrow_forwardResponse to J.C. Ethics Statement Raising our products' global profile requires a firm commitment to doing the right thing by society and the environment. By switching to a more energy-efficient cloud architecture, BillRight Software, Inc. will reduce its carbon footprint while also ensuring the absolute security of all customer data. Fair labor standards, a diverse and inclusive workforce, and giving back to the communities where our employees live and work are some of our core values. Following local regulations, accepting cultural variances, and actively participating in community development projects are all ways our brand and product will uphold our ethical values globally (Corcoran, 2024; Kotler et al., 2023; Kotler & Keller, 2024; Solomon & Russell, 2024). How MKTG 525 Gets You Together with Classmates? Different points of view in dealing with classmates from many backgrounds exposes you to many points of view, ideas, and techniques. This variety enriches the learning…arrow_forward3. Case 2) Coal plants exit, and Solar generation enters the market Now, let's consider a scenario where the coal power plant (#1) shuts down and exits the market, and a solar generation facility is constructed. The capacity of the solar generation facility is the same as the coal power plant that went out of business. The generation capacities of this market are shown below, along with their MC. Table 3: Power Plant Capacity and Marginal Cost: Case 2 Plant # Energy Source Capacity (MW) MC (S/MWh) 2 Oil 100 90 3 Natural Gas 500 50 4 Nuclear 600 0 5 Solar 300 5 Note that the solar plant (#5) can generate electricity only from 7 AM until 5PM. During these hours, the plant can generate up to its full capacity (300 MW) but cannot generate any when unavailable. (a) Draw a supply curve for each hourly market (4AM, 10 AM, 2PM, 6PM). (b) Find the market clearing prices and calculate how much electricity each power plant generates in the hourly market (4AM, 10AM, 2PM, and 6PM). (c) Find the…arrow_forward
- Respond to L.R. To analyze consumer spending, you must review the macroeconomic indicators of Personal Consumption Expenditures (PCE) and Retail Sales over the past year. Selected Macroeconomic indicators Personal Consumption Expenditures (PCE) measure the value of household goods and services consumed and are a key indicator of consumer spending. - Retail Sales: This tracks the total receipts of retail stores and provides insight into consumer demand and spending trends. - Patterns over the past year: Personal Consumption Expenditures (PCE) Over the past year, PCE has steadily increased, reflecting consumer confidence and willingness to spend. The growth rate has been moderate, driven by wage growth, low unemployment rates, and government stimulus measures. However, inflationary pressures have also impacted real purchasing power, leading to a mixed outlook. - Retail sales have also experienced fluctuations but have generally trended upwards. After a…arrow_forward4. Case 3) Electricity demand increases due to increased EV adoption We will continue using the Case 2 supply curve (with the solar plant in operation) for this analysis. Suppose that electricity consumption from electric vehicles (EV) increases significantly. Consequently, electricity demand in the wholesale market increases at every hour. The new demand levels are shown in Table 5 below. The market operator has backup power plants (using natural gas) ready, with a total capacity of 300 MW and a MC of $100/MWh. Table 5: Hourly Demand (selected hours) Hour Demand (MWh) 4 AM 800 10 AM 1000 ... 2 PM 1100 ... 6 PM 1300 (a) Find the market clearing prices and calculate how much electricity each power plant generates in the hourly market (4AM, 10AM, 2PM, and 6PM). Is there a specific hourly market in which the market operator will need to dispatch backup generation? (b) Compare the Case 2 scenario with the Case 3 scenario in terms of CO2 emissions and average electricity price. Based on…arrow_forward2. Case 1) NG price decreases Now, suppose that the price of natural gas decreased substantially, causing the marginal cost of the NG power plant to decrease to MC = $35/MWh. The demand is the same as in Case 0. (a) Draw a new supply curve that reflects the MC change of the NG power plant. (b) Find the market clearing prices and calculate how much electricity each power plant generates in the hourly market (4AM, 10AM, 2PM, and 6PM). (c) What happened to the coal power plant? (d) Do you think the market outcomes (like average price) and the total CO2 emissions have improved under this Case 1 scenario (use the emissions data provided in the lecture slides)?arrow_forward

 Principles of Economics (12th Edition)EconomicsISBN:9780134078779Author:Karl E. Case, Ray C. Fair, Sharon E. OsterPublisher:PEARSON
 Engineering Economy (17th Edition)EconomicsISBN:9780134870069Author:William G. Sullivan, Elin M. Wicks, C. Patrick KoellingPublisher:PEARSON
 Principles of Economics (MindTap Course List)EconomicsISBN:9781305585126Author:N. Gregory MankiwPublisher:Cengage Learning
 Managerial Economics: A Problem Solving ApproachEconomicsISBN:9781337106665Author:Luke M. Froeb, Brian T. McCann, Michael R. Ward, Mike ShorPublisher:Cengage Learning
 Managerial Economics & Business Strategy (Mcgraw-...EconomicsISBN:9781259290619Author:Michael Baye, Jeff PrincePublisher:McGraw-Hill Education