
Concept explainers
Videos
a.
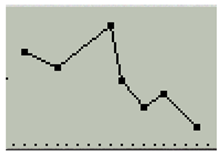
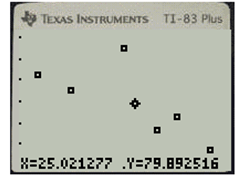
Sketch a graph of the regression line.
a.
Answer to Problem 10PPS
Explanation of Solution
Given information:
The table at the right shows the relationship between the number of students in a mathematics class and the average grade for each class.
Make a
Calculation:
Consider the table provided in the textbook which shows the relationship between the number of students in a mathematics class and the average grade of each class.
Make a scatter plot for the data using
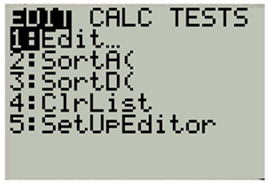
First press STAT key. Then select option 1 for the list editor and press ENTER.
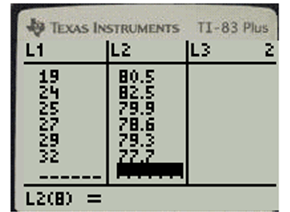
Enter the value of
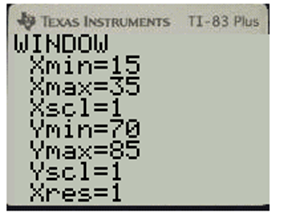
Press WINDOW key and set the viewing window to fit the data.
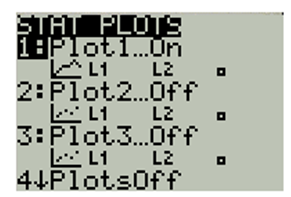
Press 2nd key and then MODE, to quit list editor. Now, press 2nd key followed by 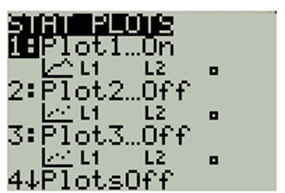
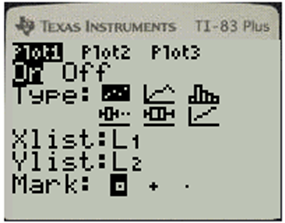
Press ENTER to get the stat plot in ON mode. Then scroll down, select scatter and press ENTER. Then press ENTER corresponding to
Press ZOOM key followed by the key
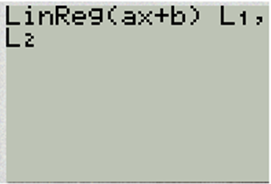
Enter the values for
Enter
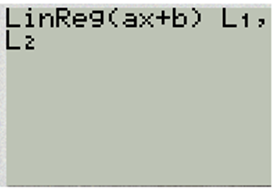
Press ENTER to get the value of
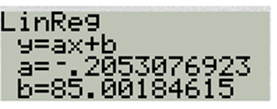
Hence the equation for line of regression is
Enter the values for
Press 2nd key and then MODE, to quit list editor. Now, press 2nd key followed by
Press ENTER to get the stat plot in ON mode. Then scroll down, select line of regression and
Press ENTER. Then press ENTER corresponding to
Press zoom key followed by the key 9, to display the graph of a linear regression.
b.
What is the
b.
Answer to Problem 10PPS
Explanation of Solution
Given information:
The table at the right shows the relationship between the number of students in a mathematics class and the average grade for each class.
What is the
Calculation:
To calculate the correlation coefficient, press 2nd key and the 0 key to enter your calculator’s catalog. Scroll until you see “diagnostics ON”.
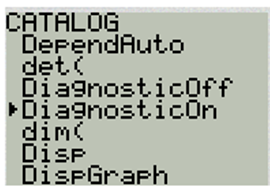
Press ENTER until the calculator screen says “Done”

Enter the values for
Then press 2nd key and then MODE, to quit list editor. Now press STAT key and choose CALC and select option 4 to obtain the correlation coefficient.
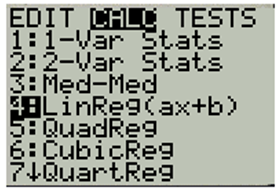
Enter
Press ENTER to get the correlation coefficient.
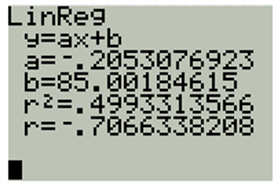
Hence, the correlation coefficient of the data is
c.
How accurate is the regression equation.
c.
Answer to Problem 10PPS
The average grade for the class decreases by about
Explanation of Solution
Given information:
The table at the right shows the relationship between the number of students in a mathematics class and the average grade for each class.
Describe the correlation? How accurate is the regression equation.
Calculation:
Consider the equation for line of regression.
It can be interpolated from the slope of regression line that the average grade for the class decreases by about
Hence, the average grade for the class decreases by about
Chapter 2 Solutions
Glencoe Algebra 2 Student Edition C2014
Additional Math Textbook Solutions
A Problem Solving Approach To Mathematics For Elementary School Teachers (13th Edition)
Elementary Statistics: Picturing the World (7th Edition)
Algebra and Trigonometry (6th Edition)
University Calculus: Early Transcendentals (4th Edition)
College Algebra with Modeling & Visualization (5th Edition)


- Problem #5 Suppose you flip a two sided fair coin ("heads" or "tails") 8 total times. a). How many ways result in 6 tails and 2 heads? b). How many ways result in 2 tails and 6 heads? c). Compare your answers to part (a) and (b) and explain in a few sentences why the comparison makes sense.arrow_forwardA local company has a 6 person management team and 20 employees. The company needs to select 3 people from the management team and 7 employees to attend a regional meeting. How many different possibilities are there for the group that can be sent to the regional meeting?arrow_forwardI have 15 outfits to select from to pack for my business trip. I would like to select three of them to pack in my suitcase. How many packing possibilities are there?arrow_forward
- There are 15 candidates running for any of 5 distinct positions on the local school board. In how many different ways could the 5 positions be filled?arrow_forwardCelina is picking a new frame for a custom piece of artwork. She has to select a frame size, material, and color. There are four different frame sizes, three different frame materials, and six different frame colors. She must chose one option only from each category. How many different possible frames could Celina pick from?arrow_forwardA research study in the year 2009 found that there were 2760 coyotes in a given region. The coyote population declined at a rate of 5.8% each year. How many fewer coyotes were there in 2024 than in 2015? Explain in at least one sentence how you solved the problem. Show your work. Round your answer to the nearest whole number.arrow_forward
 Algebra and Trigonometry (6th Edition)AlgebraISBN:9780134463216Author:Robert F. BlitzerPublisher:PEARSON
 Contemporary Abstract AlgebraAlgebraISBN:9781305657960Author:Joseph GallianPublisher:Cengage Learning
 Linear Algebra: A Modern IntroductionAlgebraISBN:9781285463247Author:David PoolePublisher:Cengage Learning
 Algebra And Trigonometry (11th Edition)AlgebraISBN:9780135163078Author:Michael SullivanPublisher:PEARSON
 Introduction to Linear Algebra, Fifth EditionAlgebraISBN:9780980232776Author:Gilbert StrangPublisher:Wellesley-Cambridge Press
 College Algebra (Collegiate Math)AlgebraISBN:9780077836344Author:Julie Miller, Donna GerkenPublisher:McGraw-Hill Education