Concept explainers
Videos
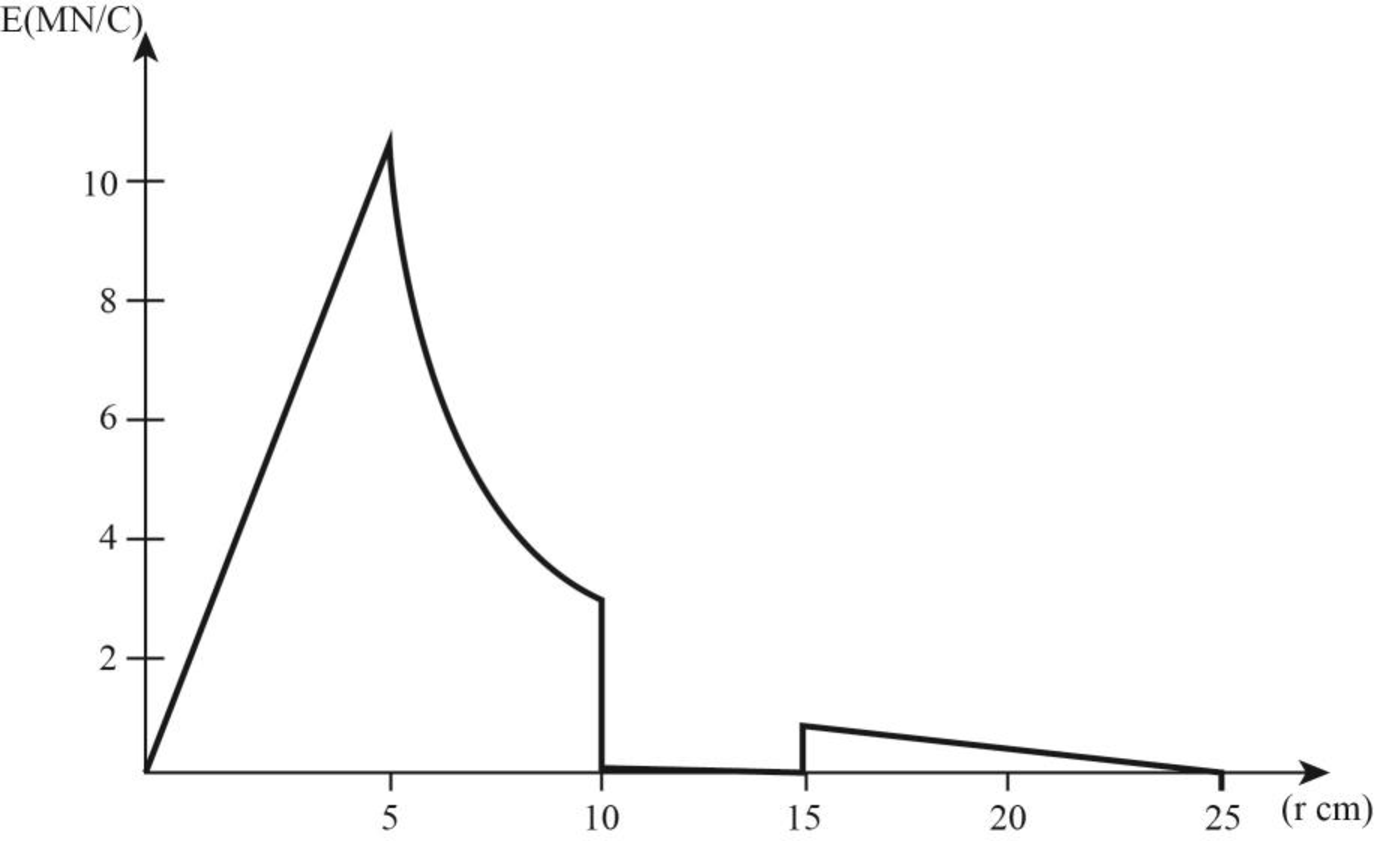
The graph of the magnitude of electric field due to the given configuration versus
Answer to Problem 55AP
The graph of the magnitude of electric field due to the given configuration versus
Explanation of Solution
Write the expression to calculate the electric field on uniformly charged sphere for
Here,
Write the expression to calculate the electric field on uniformly charged sphere for
The electric field inside a conductor is
So, for the region
Write the expression to calculate the net charge outside the sphere.
Here,
Write the expression to calculate the electric field outside the uniformly charged sphere.
Conclusion:
For
Assume
Substitute
Calculate the electric field at
Substitute
For region
At
Substitute
At
Substitute
For region
Substitute
At
The graph of the magnitude of electric field due to the given configuration versus
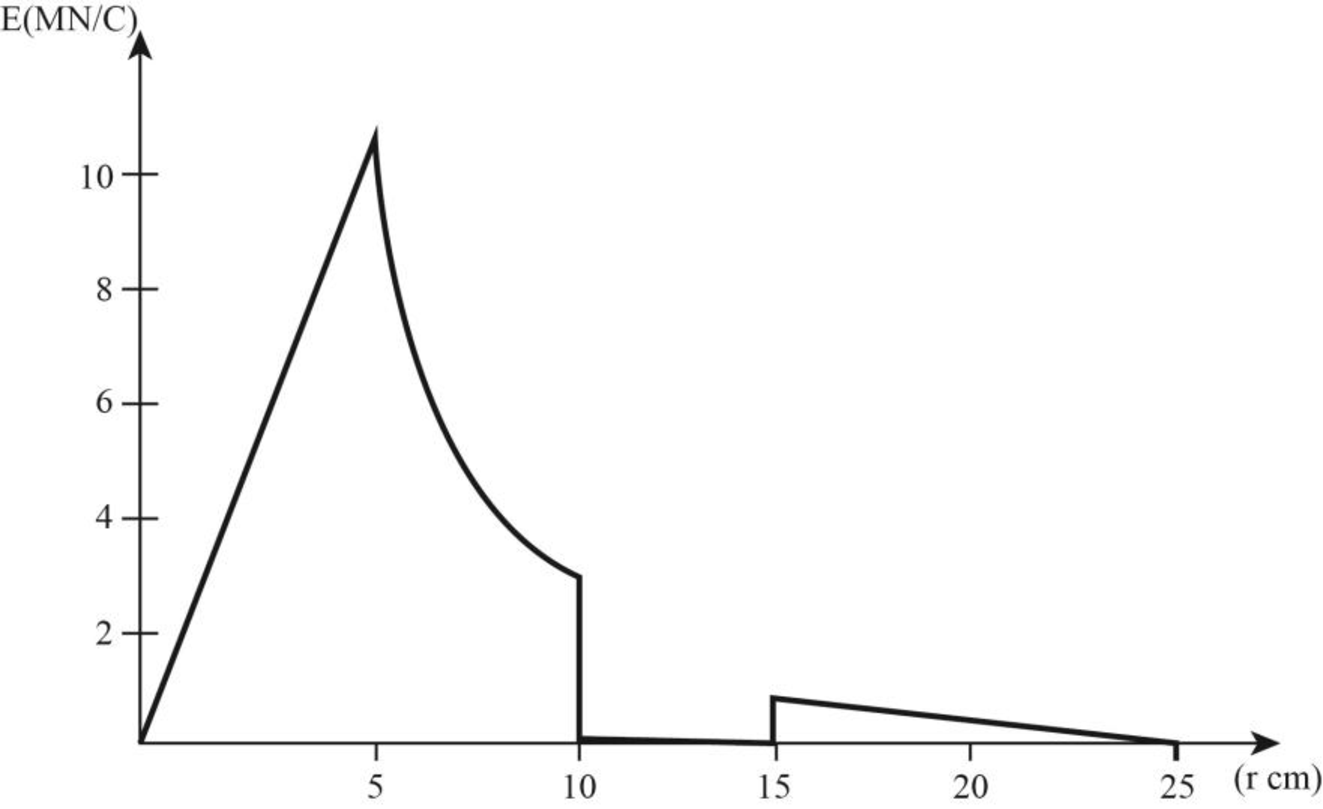
Figure (1)
Want to see more full solutions like this?
Chapter 24 Solutions
Physics for Scientists and Engineers With Modern Physics


- No chatgpt plsarrow_forwardhelp me with the experimental set up for the excel i did. the grapharrow_forwardWhich of the following best describes how to calculate the average acceleration of any object? Average acceleration is always halfway between the initial acceleration of an object and its final acceleration. Average acceleration is always equal to the change in velocity of an object divided by the time interval. Average acceleration is always equal to the displacement of an object divided by the time interval. Average acceleration is always equal to the change in speed of an object divided by the time interval.arrow_forward
- The figure shows the velocity versus time graph for a car driving on a straight road. Which of the following best describes the acceleration of the car? v (m/s) t(s) The acceleration of the car is negative and decreasing. The acceleration of the car is constant. The acceleration of the car is positive and increasing. The acceleration of the car is positive and decreasing. The acceleration of the car is negative and increasing.arrow_forwardWhich figure could represent the velocity versus time graph of a motorcycle whose speed is increasing? v (m/s) v (m/s) t(s) t(s)arrow_forwardUnlike speed, velocity is a the statement? Poisition. Direction. Vector. Scalar. quantity. Which one of the following completesarrow_forward
- No chatgpt pls will upvote Already got wrong chatgpt answerarrow_forward3.63 • Leaping the River II. A physics professor did daredevil stunts in his spare time. His last stunt was an attempt to jump across a river on a motorcycle (Fig. P3.63). The takeoff ramp was inclined at 53.0°, the river was 40.0 m wide, and the far bank was 15.0 m lower than the top of the ramp. The river itself was 100 m below the ramp. Ignore air resistance. (a) What should his speed have been at the top of the ramp to have just made it to the edge of the far bank? (b) If his speed was only half the value found in part (a), where did he land? Figure P3.63 53.0° 100 m 40.0 m→ 15.0 marrow_forwardPlease solve and answer the question correctly please. Thank you!!arrow_forward
 Physics for Scientists and Engineers: Foundations...PhysicsISBN:9781133939146Author:Katz, Debora M.Publisher:Cengage Learning
 Principles of Physics: A Calculus-Based TextPhysicsISBN:9781133104261Author:Raymond A. Serway, John W. JewettPublisher:Cengage Learning
 Physics for Scientists and EngineersPhysicsISBN:9781337553278Author:Raymond A. Serway, John W. JewettPublisher:Cengage Learning
 Physics for Scientists and Engineers with Modern ...PhysicsISBN:9781337553292Author:Raymond A. Serway, John W. JewettPublisher:Cengage Learning
 College PhysicsPhysicsISBN:9781305952300Author:Raymond A. Serway, Chris VuillePublisher:Cengage Learning
 Physics for Scientists and Engineers, Technology ...PhysicsISBN:9781305116399Author:Raymond A. Serway, John W. JewettPublisher:Cengage Learning