
Pearson eText for Statistical Reasoning for Everyday Life -- Instant Access (Pearson+)
5th Edition
ISBN: 9780137561544
Author: Jeffrey Bennett, William Briggs
Publisher: PEARSON+
expand_more
expand_more
format_list_bulleted
Concept explainers
Videos
Textbook Question
Chapter 2.4, Problem 22E
Pizza Cost and Subway Fare. The “pizza connection” refers to the observation that in New York City, the cost of a slice of pizza is always about the same as the subway fare. In Exercises 21–24, use the CPI values from Table 2.2 and the data in the following table.
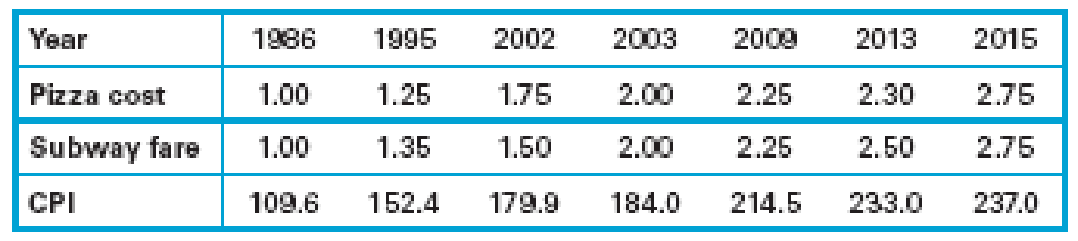
22. Cost of Pizza in 2014. Using the CPI values from the above table and Table 2.2, determine what a slice of pizza should have cost in 2014 if it cost $1.35 in 1995 and prices had risen with the CPI. What does this tell you about how actual pizza prices changed compared to the CPI?
Expert Solution & Answer
Want to see the full answer?
Check out a sample textbook solution
Students have asked these similar questions
A survey of 581 citizens found that 313 of them favor a new bill introduced by the city.
We want to find a 95% confidence interval for the true proportion of the population who favor the bill.
What is the lower limit of the interval? Enter the result as a decimal rounded to 3 decimal digits.
Your Answer:
2. The SMSA data consisting of 141 observations on 10 variables is fitted by the model
below:
1
y = Bo+B1x4 + ẞ2x6 + ẞ3x8 + √1X4X8 + V2X6X8 + €.
See Question 2, Tutorial 3 for the meaning of the variables in the above model.
The following results are obtained:
Estimate Std. Error t value Pr(>|t|)
(Intercept) 1.302e+03 4.320e+02 3.015 0.00307
x4
x6
x8
x4:x8
x6:x8
-1.442e+02
2.056e+01 -7.013 1.02e-10
6.340e-01 6.099e+00 0.104 0.91737
-9.455e-02 5.802e-02 -1.630
0.10550
2.882e-02 2.589e-03 11.132
1.673e-03 7.215e-04 2.319
F)
x4
1
3486722
3486722
17.9286 4.214e-05
x6
1
14595537
x8
x4:x8
x6:x8
1
132.4836 < 2.2e-16
1045693
194478
5.3769 0.02191
1 1198603043 1198603043 6163.1900 < 2.2e-16
1 25765100 25765100
1045693
Residuals 135 26254490
Estimated variance matrix
(Intercept)
x4
x6
x8
x4:x8
x6:x8
(Intercept)
x4
x6
x8
x4:x8
x6:x8
0.18875694
1.866030e+05 -5.931735e+03 -2.322825e+03 -16.25142055 0.57188953
-5.931735e+03 4.228816e+02 3.160915e+01 0.61621781 -0.03608028 -0.00445013
-2.322825e+03…
In some applications the distribution of a discrete RV, X resembles the Poisson distribution except that 0 is not a possible value of X. Consider such a RV with PMF
where 1 > 0 is a parameter, and c is a constant.
(a) Find the expression of c in terms of 1.
(b) Find E(X).
(Hint: You can use the fact that, if Y ~ Poisson(1), the E(Y) = 1.)
Chapter 2 Solutions
Pearson eText for Statistical Reasoning for Everyday Life -- Instant Access (Pearson+)
Ch. 2.1 - Qualitative versus Quantitative. What is the...Ch. 2.1 - Discrete versus Continuous. Distinguish between...Ch. 2.1 - Measurement Levels. What do we mean by data at the...Ch. 2.1 - Interval versus Ratio. Explain why temperatures on...Ch. 2.1 - Does It Make Sense? For Exercises 58, determine...Ch. 2.1 - Does It Make Sense? For Exercises 58, determine...Ch. 2.1 - Does It Make Sense? For Exercises 58, determine...Ch. 2.1 - Does It Make Sense? For Exercises 58, determine...Ch. 2.1 - Does It Make Sense? For Exercises 58, determine...Ch. 2.1 - Does It Make Sense? For Exercises 58, determine...
Ch. 2.1 - Does It Make Sense? For Exercises 58, determine...Ch. 2.1 - Does It Make Sense? For Exercises 58, determine...Ch. 2.1 - Does It Make Sense? For Exercises 58, determine...Ch. 2.1 - Does It Make Sense? For Exercises 58, determine...Ch. 2.1 - Does It Make Sense? For Exercises 58, determine...Ch. 2.1 - Does It Make Sense? For Exercises 58, determine...Ch. 2.1 - Qualitative versus Quantitative Data. In Exercises...Ch. 2.1 - Qualitative versus Quantitative Data. In Exercises...Ch. 2.1 - Discrete or Continuous. In Exercises 1928, state...Ch. 2.1 - Discrete or Continuous. In Exercises 1928, state...Ch. 2.1 - Discrete or Continuous. In Exercises 1928, state...Ch. 2.1 - Discrete or Continuous. In Exercises 1928, state...Ch. 2.1 - Discrete or Continuous. In Exercises 1928, state...Ch. 2.1 - Discrete or Continuous. In Exercises 1928, state...Ch. 2.1 - Discrete or Continuous. In Exercises 1928, state...Ch. 2.1 - Discrete or Continuous. In Exercises 1928, state...Ch. 2.1 - Discrete or Continuous. In Exercises 1928, state...Ch. 2.1 - Discrete or Continuous. In Exercises 1928, state...Ch. 2.1 - Levels of Measurement. For the data described in...Ch. 2.1 - Levels of Measurement. For the data described in...Ch. 2.1 - Levels of Measurement. For the data described in...Ch. 2.1 - Levels of Measurement. For the data described in...Ch. 2.1 - Levels of Measurement. For the data described in...Ch. 2.1 - Levels of Measurement. For the data described in...Ch. 2.1 - Levels of Measurement. For the data described in...Ch. 2.1 - Levels of Measurement. For the data described in...Ch. 2.1 - Levels of Measurement. For the data described in...Ch. 2.1 - Levels of Measurement. For the data described in...Ch. 2.1 - Levels of Measurement. For the data described in...Ch. 2.1 - Levels of Measurement. For the data described in...Ch. 2.1 - Meaningful Ratios? In Exercises 4148, determine...Ch. 2.1 - Meaningful Ratios? In Exercises 4148, determine...Ch. 2.1 - Meaningful Ratios? In Exercises 4148, determine...Ch. 2.1 - Meaningful Ratios? In Exercises 4148, determine...Ch. 2.1 - Meaningful Ratios? In Exercises 4148, determine...Ch. 2.1 - Meaningful Ratios? In Exercises 4148, determine...Ch. 2.1 - Meaningful Ratios? In Exercises 4148, determine...Ch. 2.1 - Meaningful Ratios? In Exercises 4148, determine...Ch. 2.1 - Complete Classification. In Exercises 4956,...Ch. 2.1 - Complete Classification. In Exercises 4956,...Ch. 2.1 - Complete Classification. In Exercises 4956,...Ch. 2.1 - Complete Classification. In Exercises 4956,...Ch. 2.1 - Prob. 53ECh. 2.1 - Complete Classification. In Exercises 4956,...Ch. 2.1 - Prob. 55ECh. 2.1 - Complete Classification. In Exercises 4956,...Ch. 2.2 - Error Type. Distinguish between random errors and...Ch. 2.2 - Absolute and Relative. Distinguish between the...Ch. 2.2 - Accuracy and Precision. Distinguish between...Ch. 2.2 - Honest Numbers. Why can it be misleading to give...Ch. 2.2 - Does It Make Sense? For Exercises 58, determine...Ch. 2.2 - Does It Make Sense? For Exercises 58, determine...Ch. 2.2 - Does It Make Sense? For Exercises 58, determine...Ch. 2.2 - Does It Make Sense? For Exercises 58, determine...Ch. 2.2 - IRS. An IRS agent reviews tax returns to identify...Ch. 2.2 - Safe Air Travel. Before taking off, a pilot is...Ch. 2.2 - Technical Specifications. A smartphone battery is...Ch. 2.2 - Crime Statistics. Former New York City Police...Ch. 2.2 - Sources of Errors. For each measurement described...Ch. 2.2 - Sources of Errors. For each measurement described...Ch. 2.2 - Sources of Errors. For each measurement described...Ch. 2.2 - Sources of Errors. For each measurement described...Ch. 2.2 - Sources of Errors. For each measurement described...Ch. 2.2 - Sources of Errors. For each measurement described...Ch. 2.2 - Sources of Errors. For each measurement described...Ch. 2.2 - Sources of Errors. For each measurement described...Ch. 2.2 - Absolute and Relative Errors. In Exercises 2124,...Ch. 2.2 - Absolute and Relative Errors. In Exercises 2124,...Ch. 2.2 - Absolute and Relative Errors. In Exercises 2124,...Ch. 2.2 - Absolute and Relative Errors. In Exercises 2124,...Ch. 2.2 - Minimizing Errors. Twenty-five people, including...Ch. 2.2 - Minimizing Errors. When a model 22F car battery is...Ch. 2.2 - Accuracy and Precision in Corvette Weight. A new...Ch. 2.2 - Accuracy and Precision in Height. Assume that your...Ch. 2.2 - Accuracy and Precision in Weight. Suppose your...Ch. 2.2 - Prob. 30ECh. 2.2 - Believable Facts? Exercises 3138 give statements...Ch. 2.2 - Believable Facts? Exercises 3138 give statements...Ch. 2.2 - Prob. 33ECh. 2.2 - Believable Facts? Exercises 3138 give statements...Ch. 2.2 - Prob. 35ECh. 2.2 - Believable Facts? Exercises 3138 give statements...Ch. 2.2 - Believable Facts? Exercises 3138 give statements...Ch. 2.2 - Believable Facts? Exercises 3138 give statements...Ch. 2.3 - Statistical Literacy and Critical Thinking...Ch. 2.3 - Percentage Difference. Distinguish between...Ch. 2.3 - Of versus More Than. Explain the difference...Ch. 2.3 - Percentage Points. Explain the difference between...Ch. 2.3 - Does It Make Sense? For Exercises 58, determine...Ch. 2.3 - Does It Make Sense? For Exercises 58, determine...Ch. 2.3 - Does It Make Sense? For Exercises 58, determine...Ch. 2.3 - Does It Make Sense? For Exercises 58, determine...Ch. 2.3 - Concepts and Applications Fractions, Decimals,...Ch. 2.3 - Fractions, Decimals, Percentages. Express the...Ch. 2.3 - Percentage Practice. A study was conducted of...Ch. 2.3 - Percentage Practice. A study was conducted to...Ch. 2.3 - Percentage of Media commonly report survey...Ch. 2.3 - Percentage. A New York Times editorial criticized...Ch. 2.3 - Relative Change. Exercises 1522 each provide two...Ch. 2.3 - Relative Change. Exercises 1522 each provide two...Ch. 2.3 - Relative Change. Exercises 1522 each provide two...Ch. 2.3 - Relative Change. Exercises 1522 each provide two...Ch. 2.3 - Relative Change. Exercises 1522 each provide two...Ch. 2.3 - Relative Change. Exercises 1522 each provide two...Ch. 2.3 - Relative Change. Exercises 1522 each provide two...Ch. 2.3 - Relative Change. Exercises 1522 each provide two...Ch. 2.3 - Surveys. Some important analyses of survey results...Ch. 2.3 - Surveys. Some important analyses of survey results...Ch. 2.3 - Surveys. Some important analyses of survey results...Ch. 2.3 - Surveys. Some important analyses of survey results...Ch. 2.3 - Of versus More Than. Fill in the blanks in...Ch. 2.3 - Of versus More Than. Fill in the blanks in...Ch. 2.3 - Of versus More Than. Fill in the blanks in...Ch. 2.3 - Of versus More Than. Fill in the blanks in...Ch. 2.3 - Margin of Error. A Gallup poll of 1012 American...Ch. 2.3 - Margin of Error. A Pew Research Center survey of...Ch. 2.3 - Percentages of Percentages. Exercises 3336...Ch. 2.3 - Percentages of Percentages. Exercises 3336...Ch. 2.3 - Percentages of Percentages. Exercises 3336...Ch. 2.3 - Percentages of Percentages. Exercises 3336...Ch. 2.3 - TV Share. A recent Super Bowl football game had a...Ch. 2.3 - Misleading Percentage. In a Gallup poll of 1236...Ch. 2.4 - Index Number. What is an index number? Briefly...Ch. 2.4 - CPI. What is the Consumer Price Index (CPI)? How...Ch. 2.4 - Inflation. In making price comparisons, why is it...Ch. 2.4 - CPI Change. If the CPI increases, must wages also...Ch. 2.4 - Does It Make Sense? For Exercises 58, determine...Ch. 2.4 - Does It Make Sense? For Exercises 58, determine...Ch. 2.4 - Does It Make Sense? For Exercises 58, determine...Ch. 2.4 - Does It Make Sense? For Exercises 58, determine...Ch. 2.4 - Consumer Price Index. In Exercises 916, use the...Ch. 2.4 - Consumer Price Index. In Exercises 916, use the...Ch. 2.4 - Consumer Price Index. In Exercises 916, use the...Ch. 2.4 - Consumer Price Index. In Exercises 916, use the...Ch. 2.4 - Prob. 13ECh. 2.4 - Consumer Price Index. In Exercises 916, use the...Ch. 2.4 - Consumer Price Index. In Exercises 916, use the...Ch. 2.4 - Consumer Price Index. In Exercises 916, use the...Ch. 2.4 - Coffee Index. In Exercises 1720, use the following...Ch. 2.4 - Prob. 18ECh. 2.4 - Prob. 19ECh. 2.4 - Coffee Index. In Exercises 1720, use the following...Ch. 2.4 - Pizza Cost and Subway Fare. The pizza connection...Ch. 2.4 - Pizza Cost and Subway Fare. The pizza connection...Ch. 2.4 - Pizza Cost and Subway Fare. The pizza connection...Ch. 2.4 - Pizza Cost and Subway Fare. The pizza connection...Ch. 2.4 - Prob. 25ECh. 2.4 - Prob. 26ECh. 2.4 - Prob. 27ECh. 2.4 - Housing Price Index. Realtors use an index to...Ch. 2.4 - Prob. 29ECh. 2.4 - Housing Price Index. Realtors use an index to...Ch. 2.4 - Prob. 31ECh. 2.4 - Housing Price Index. Realtors use an index to...Ch. 2 - Germs. In a Wakefield Research survey, 1003...Ch. 2 - Health Care Spending. Total spending on health...Ch. 2 - Prob. 3CRECh. 2 - Minimum Wage. The following table lists the...Ch. 2 - Braking reaction times of 36 randomly selected...Ch. 2 - What is the level of measurement of the values...Ch. 2 - Prob. 3CQCh. 2 - A researcher measures the braking reaction time of...Ch. 2 - Braking reaction times of 36 randomly selected...Ch. 2 - Recorded survey results include the states in...Ch. 2 - Prob. 7CQCh. 2 - Prob. 8CQCh. 2 - Prob. 9CQCh. 2 - Prob. 10CQCh. 2 - Politics Who Benefited Most from Lower Tax Rates?...Ch. 2 - Prob. 1.2FCh. 2 - Prob. 1.3F
Knowledge Booster


Learn more about
Need a deep-dive on the concept behind this application? Look no further. Learn more about this topic, statistics and related others by exploring similar questions and additional content below.Similar questions
- Suppose that X ~Bin(n,p). Show that E[(1 - p)] = (1-p²)".arrow_forwardI need help with this problem and an explanation of the solution for the image described below. (Statistics: Engineering Probabilities)arrow_forwardI need help with this problem and an explanation of the solution for the image described below. (Statistics: Engineering Probabilities)arrow_forward
- This exercise is based on the following data on four bodybuilding supplements. (Figures shown correspond to a single serving.) Creatine(grams) L-Glutamine(grams) BCAAs(grams) Cost($) Xtend(SciVation) 0 2.5 7 1.00 Gainz(MP Hardcore) 2 3 6 1.10 Strongevity(Bill Phillips) 2.5 1 0 1.20 Muscle Physique(EAS) 2 2 0 1.00 Your personal trainer suggests that you supplement with at least 10 grams of creatine, 39 grams of L-glutamine, and 90 grams of BCAAs each week. You are thinking of combining Xtend and Gainz to provide you with the required nutrients. How many servings of each should you combine to obtain a week's supply that meets your trainer's specifications at the least cost? (If an answer does not exist, enter DNE.) servings of xtend servings of gainzarrow_forwardI need help with this problem and an explanation of the solution for the image described below. (Statistics: Engineering Probabilities)arrow_forwardI need help with this problem and an explanation of the solution for the image described below. (Statistics: Engineering Probabilities)arrow_forward
- DATA TABLE VALUES Meal Price ($) 22.78 31.90 33.89 22.77 18.04 23.29 35.28 42.38 36.88 38.55 41.68 25.73 34.19 31.75 25.24 26.32 19.57 36.57 32.97 36.83 30.17 37.29 25.37 24.71 28.79 32.83 43.00 35.23 34.76 33.06 27.73 31.89 38.47 39.42 40.72 43.92 36.51 45.25 33.51 29.17 30.54 26.74 37.93arrow_forwardI need help with this problem and an explanation of the solution for the image described below. (Statistics: Engineering Probabilities)arrow_forwardSales personnel for Skillings Distributors submit weekly reports listing the customer contacts made during the week. A sample of 65 weekly reports showed a sample mean of 19.5 customer contacts per week. The sample standard deviation was 5.2. Provide 90% and 95% confidence intervals for the population mean number of weekly customer contacts for the sales personnel. 90% Confidence interval, to 2 decimals: ( , ) 95% Confidence interval, to 2 decimals:arrow_forward
- A simple random sample of 40 items resulted in a sample mean of 25. The population standard deviation is 5. a. What is the standard error of the mean (to 2 decimals)? b. At 95% confidence, what is the margin of error (to 2 decimals)?arrow_forwardmean trough level of the population to be 3.7 micrograms/mL. The researcher conducts a study among 93 newly diagnosed arthritis patients and finds the mean trough to be 4.1 micrograms/mL with a standard deviation of 2.4 micrograms/mL. The researcher wants to test at the 5% level of significance if the trough is different than previously reported or not. Z statistics will be used. Complete Step 5 of hypothesis testing: Conclusion. State whether or not you would reject the null hypothesis and why. Also interpret what this means (i.e. is the mean trough different from 3.7 or noarrow_forward30% of all college students major in STEM (Science, Technology, Engineering, and Math). If 48 college students are randomly selected, find the probability thata. Exactly 12 of them major in STEM. b. At most 17 of them major in STEM. c. At least 12 of them major in STEM. d. Between 9 and 13 (including 9 and 13) of them major in STEM.arrow_forward
arrow_back_ios
SEE MORE QUESTIONS
arrow_forward_ios
Recommended textbooks for you
 Glencoe Algebra 1, Student Edition, 9780079039897...AlgebraISBN:9780079039897Author:CarterPublisher:McGraw Hill
 Big Ideas Math A Bridge To Success Algebra 1: Stu...AlgebraISBN:9781680331141Author:HOUGHTON MIFFLIN HARCOURTPublisher:Houghton Mifflin Harcourt
 Holt Mcdougal Larson Pre-algebra: Student Edition...AlgebraISBN:9780547587776Author:HOLT MCDOUGALPublisher:HOLT MCDOUGAL
Glencoe Algebra 1, Student Edition, 9780079039897...
Algebra
ISBN:9780079039897
Author:Carter
Publisher:McGraw Hill
Big Ideas Math A Bridge To Success Algebra 1: Stu...
Algebra
ISBN:9781680331141
Author:HOUGHTON MIFFLIN HARCOURT
Publisher:Houghton Mifflin Harcourt
Holt Mcdougal Larson Pre-algebra: Student Edition...
Algebra
ISBN:9780547587776
Author:HOLT MCDOUGAL
Publisher:HOLT MCDOUGAL
The Shape of Data: Distributions: Crash Course Statistics #7; Author: CrashCourse;https://www.youtube.com/watch?v=bPFNxD3Yg6U;License: Standard YouTube License, CC-BY
Shape, Center, and Spread - Module 20.2 (Part 1); Author: Mrmathblog;https://www.youtube.com/watch?v=COaid7O_Gag;License: Standard YouTube License, CC-BY
Shape, Center and Spread; Author: Emily Murdock;https://www.youtube.com/watch?v=_YyW0DSCzpM;License: Standard Youtube License