Fuel economy. According to the U.S. Department of Energy, a vehicle’s fuel economy, in miles per gallon (mpg), decreases rapidly for speeds over 60 mph. (Sources: U.S. Dept. of Energy; a study by West, B.H., McGill, R.N., Hodgson, J.W., Sluder, S.S., and Smith, D.E., Oak Ridge National Laboratory, 1999; www.mpgforspeed.com, 2014.) a. Estimate the speed at which the absolute maximum gasoline mileage is obtained. b. Estimate the speed at which the absolute minimum gasoline mileage is obtained. c. What is the mileage obtained at 70 mph?
Fuel economy. According to the U.S. Department of Energy, a vehicle’s fuel economy, in miles per gallon (mpg), decreases rapidly for speeds over 60 mph. (Sources: U.S. Dept. of Energy; a study by West, B.H., McGill, R.N., Hodgson, J.W., Sluder, S.S., and Smith, D.E., Oak Ridge National Laboratory, 1999; www.mpgforspeed.com, 2014.) a. Estimate the speed at which the absolute maximum gasoline mileage is obtained. b. Estimate the speed at which the absolute minimum gasoline mileage is obtained. c. What is the mileage obtained at 70 mph?
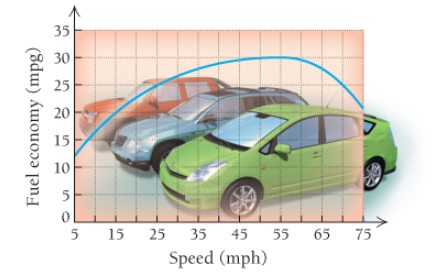
Fuel economy. According to the U.S. Department of Energy, a vehicle’s fuel economy, in miles per gallon (mpg), decreases rapidly for speeds over 60 mph.
(Sources: U.S. Dept. of Energy; a study by West, B.H., McGill, R.N., Hodgson, J.W., Sluder, S.S., and Smith, D.E., Oak Ridge National Laboratory, 1999; www.mpgforspeed.com, 2014.)
a. Estimate the speed at which the absolute maximum gasoline mileage is obtained.
b. Estimate the speed at which the absolute minimum gasoline mileage is obtained.
Let the region R be the area enclosed by the function f(x)= = 3x² and g(x) = 4x. If the region R is the
base of a solid such that each cross section perpendicular to the x-axis is an isosceles right triangle with a
leg in the region R, find the volume of the solid. You may use a calculator and round to the nearest
thousandth.
y
11
10
9
00
8
7
9
5
4
3
2
1
-1
-1
x
1
2
Let the region R be the area enclosed by the function f(x) = ex — 1, the horizontal line y = -4 and
the vertical lines x = 0 and x = 3. Find the volume of the solid generated when the region R is revolved
about the line y = -4. You may use a calculator and round to the nearest thousandth.
20
15
10
5
y
I
I
I
|
I
+
-1.5
-1
-0.5
0.5
1
1.5
2
2.5
3
-5
I
-10
-15
I
+
I
I
T
I
I
+
-20
I
+
-25
I
I
I
-30
I
3.5
4
x
Need a deep-dive on the concept behind this application? Look no further. Learn more about this topic, calculus and related others by exploring similar questions and additional content below.
Hypothesis Testing using Confidence Interval Approach; Author: BUM2413 Applied Statistics UMP;https://www.youtube.com/watch?v=Hq1l3e9pLyY;License: Standard YouTube License, CC-BY
Hypothesis Testing - Difference of Two Means - Student's -Distribution & Normal Distribution; Author: The Organic Chemistry Tutor;https://www.youtube.com/watch?v=UcZwyzwWU7o;License: Standard Youtube License


 Big Ideas Math A Bridge To Success Algebra 1: Stu...AlgebraISBN:9781680331141Author:HOUGHTON MIFFLIN HARCOURTPublisher:Houghton Mifflin Harcourt
 Glencoe Algebra 1, Student Edition, 9780079039897...AlgebraISBN:9780079039897Author:CarterPublisher:McGraw Hill
 Linear Algebra: A Modern IntroductionAlgebraISBN:9781285463247Author:David PoolePublisher:Cengage Learning
 Functions and Change: A Modeling Approach to Coll...AlgebraISBN:9781337111348Author:Bruce Crauder, Benny Evans, Alan NoellPublisher:Cengage Learning