
Elementary Statistics with Student Access Kit
12th Edition
ISBN: 9780321869470
Author: Mario F. Triola
Publisher: PEARSON
expand_more
expand_more
format_list_bulleted
Videos
Textbook Question
Chapter 2.3, Problem 8BSC
Interpreting a Histogram. In Exercises 5-8, answer the questions by referring to the following Minitab-generated histogram, which represents the heights (inches) of people randomly selected from those who entered New York City’s Museum of Natural History during a recent Friday morning.
MINITAB
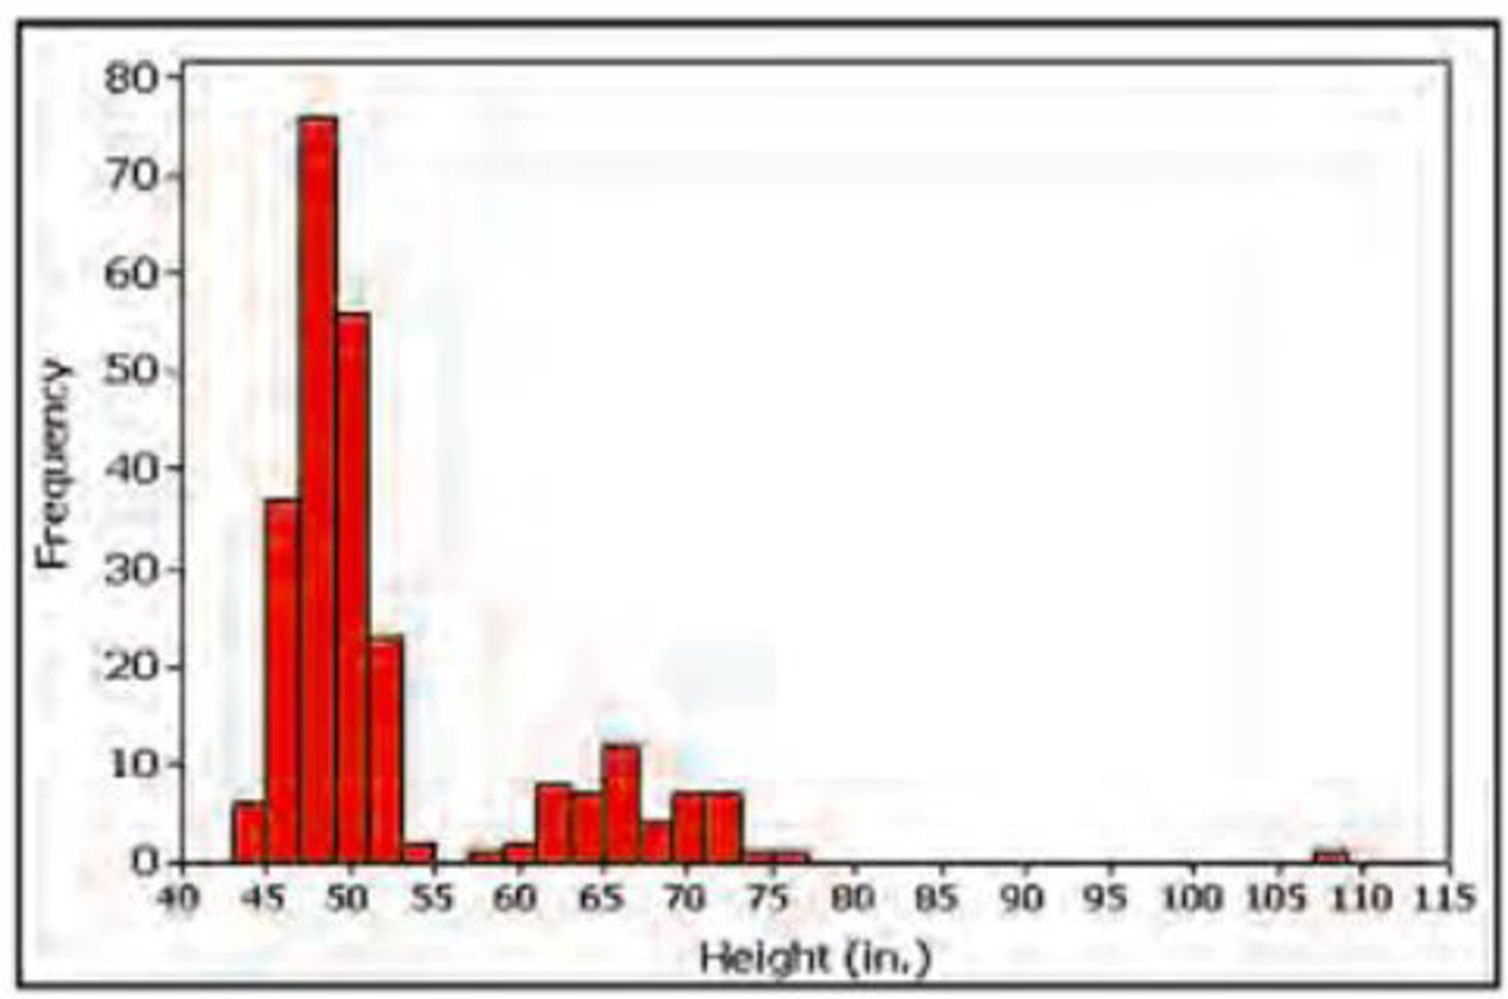
8. Gap What is a reasonable explanation for the gap between the group of people with heights between 43 in. and 55 in., and the group of people with heights between 57 in. and 77 in.?
Expert Solution & Answer
Want to see the full answer?
Check out a sample textbook solution
Students have asked these similar questions
if the b coloumn of a z table disappeared what would be used to determine b column probabilities
Construct a model of population flow between metropolitan and nonmetropolitan areas of a given country, given that their respective populations in 2015 were 263 million and 45 million. The probabilities
are given by the following matrix.
(from)
(to)
metro nonmetro
0.99 0.02 metro
0.01 0.98
nonmetro
Predict the population distributions of metropolitan and nonmetropolitan areas for the years 2016 through 2020 (in millions, to four decimal places). (Let x, through x5 represent the years 2016 through
2020, respectively.)
x₁ =
x2
X3
261.27
46.73
11
259.59
48.41
11
257.96
50.04
11
256.39
51.61
11
t
If the average price of a new one family home is $246,300 with a standard deviation of $15,000 find the minimum and maximum prices of the houses that a contractor will build to satisfy 88% of the market value
Chapter 2 Solutions
Elementary Statistics with Student Access Kit
Ch. 2.2 - Frequency Distribution Table 2-2 on page 45 is a...Ch. 2.2 - Relative Frequency Distribution After construction...Ch. 2.2 - Do You Believe? In a Harris Interactive survey,...Ch. 2.2 - Analyzing a Frequency Distribution The...Ch. 2.2 - In Exercises 5-10, identify the class width, class...Ch. 2.2 - In Exercises 5-10, identify the class width, class...Ch. 2.2 - In Exercises 5-10, identify the class width, class...Ch. 2.2 - In Exercises 5-10, identify the class width, class...Ch. 2.2 - In Exercises 5-10, identify the class width, class...Ch. 2.2 - In Exercises 5-10, identify the class width, class...
Ch. 2.2 - Normal Distributions. In Exercises 11-14, answer...Ch. 2.2 - Normal Distributions. In Exercises 11-14, answer...Ch. 2.2 - Normal Distributions. In Exercises 11-14, answer...Ch. 2.2 - Normal Distributions. In Exercises 11-14, answer...Ch. 2.2 - Relative Frequencies for Comparisons. In Exercises...Ch. 2.2 - Relative Frequencies for Comparisons. In Exercises...Ch. 2.2 - Cumulative Frequency Distributions. In Exercises...Ch. 2.2 - Cumulative Frequency Distributions. In Exercises...Ch. 2.2 - Analysis of Last Digits Heights of statistics...Ch. 2.2 - Analysis of Last Digits Weights of respondents...Ch. 2.2 - Constructing Frequency Distributions. In Exercises...Ch. 2.2 - Constructing Frequency Distributions. In Exercises...Ch. 2.2 - Constructing Frequency Distributions. In Exercises...Ch. 2.2 - Constructing Frequency Distributions. In Exercises...Ch. 2.2 - Constructing Frequency Distributions. In Exercises...Ch. 2.2 - Constructing Frequency Distributions. In Exercises...Ch. 2.2 - Constructing Frequency Distributions. In Exercises...Ch. 2.2 - Constructing Frequency Distributions. In Exercises...Ch. 2.2 - Categorical Data. In Exercises 29-32, use the...Ch. 2.2 - Categorical Data. In Exercises 29-32, use the...Ch. 2.2 - Categorical Data. In Exercises 29-32, use the...Ch. 2.2 - Categorical Data. In Exercises 29-32, use the...Ch. 2.2 - Interpreting Effects of Outliers Refer to Data Set...Ch. 2.2 - Number of Classes According to what is known as...Ch. 2.3 - Prob. 1BSCCh. 2.3 - Voluntary Response Sample The histogram in Figure...Ch. 2.3 - Small Data NASA provides these duration times (in...Ch. 2.3 - Normal Distribution When it refers to a normal...Ch. 2.3 - Interpreting a Histogram. In Exercises 5-8, answer...Ch. 2.3 - Interpreting a Histogram. In Exercises 5-8, answer...Ch. 2.3 - Interpreting a Histogram. In Exercises 5-8, answer...Ch. 2.3 - Interpreting a Histogram. In Exercises 5-8, answer...Ch. 2.3 - Analysis of Last Digits Use the frequency...Ch. 2.3 - Analysis of Last Digits Use the frequency...Ch. 2.3 - Constructing Histograms. In Exercises 9-18,...Ch. 2.3 - Constructing Histograms. In Exercises 9-18,...Ch. 2.3 - Constructing Histograms. In Exercises 9-18,...Ch. 2.3 - Constructing Histograms. In Exercises 9-18,...Ch. 2.3 - Prob. 15BSCCh. 2.3 - Constructing Histograms. In Exercises 9-18,...Ch. 2.3 - Constructing Histograms. In Exercises 9-18,...Ch. 2.3 - Constructing Histograms. In Exercises 9-18,...Ch. 2.3 - Back-to-Back Relative Frequency Histograms When...Ch. 2.3 - Interpreting a Histogram. In Exercises 5-8, answer...Ch. 2.4 - Bar Chart and Pareto Chart A bar chart and a...Ch. 2.4 - Scatterplot What is a scatterplot? What type of...Ch. 2.4 - SAT Scores Listed below are SAT scores from a...Ch. 2.4 - SAT Scores Given that the data in Exercise 3 were...Ch. 2.4 - Scatterplots. In Exercises 5-8, use the given...Ch. 2.4 - Scatterplots. In Exercises 5-8, use the given...Ch. 2.4 - Scatterplots. In Exercises 5-8, use the given...Ch. 2.4 - Scatterplots. In Exercises 5-8, use the given...Ch. 2.4 - Time-Series Graphs. In Exercises 9 and 10,...Ch. 2.4 - Time-Series Graphs. In Exercises 9 and 10,...Ch. 2.4 - Dotplots. In Exercises II and 12, construct the...Ch. 2.4 - Dotplots. In Exercises 11 and 12, construct the...Ch. 2.4 - Stemplots. In Exercises 13 and 14, construct the...Ch. 2.4 - Stemplots. In Exercises 13 and 14, construct the...Ch. 2.4 - Pareto Charts. In Exercises 15 and 16, construct...Ch. 2.4 - Pareto Charts. In Exercises 15 and 16, construct...Ch. 2.4 - Pie Charts. In Exercises 17 and 18, construct the...Ch. 2.4 - Pie Charts. In Exercises 17 and 18, construct the...Ch. 2.4 - Frequency Polygon. In Exercises 19 and 20,...Ch. 2.4 - Frequency Polygon. In Exercises 19 and 20,...Ch. 2.4 - Deceptive Graphs. In Exercises 21-24, identify the...Ch. 2.4 - Deceptive Graphs. In Exercises 21-24, identify the...Ch. 2.4 - Deceptive Graphs. In Exercises 21-24, identify the...Ch. 2.4 - Deceptive Graphs. In Exercises 21-24, identify the...Ch. 2.4 - Back-to-Back Stemplots Exercise 19 in Section 2-3...Ch. 2 - When one is constructing a table representing the...Ch. 2 - When one is constructing a table representing the...Ch. 2 - When one is constructing a table representing the...Ch. 2 - A stemplot is created from the intervals (min)...Ch. 2 - In the California Daily 4 lottery, four digits...Ch. 2 - In an investigation of the travel costs of college...Ch. 2 - In an investigation of the relationship between...Ch. 2 - As a quality control manager at Sony, you find...Ch. 2 - What characteristic of a data set can be better...Ch. 2 - A histogram is to be constructed from the brain...Ch. 2 - Frequency Distribution of Brain Volumes Construct...Ch. 2 - Histogram of Brain Volumes Construct the histogram...Ch. 2 - Dotplot of California Lottery In the California...Ch. 2 - Stemplot of IQ Scores Listed below are the first...Ch. 2 - CO Emissions Listed below are the amounts (million...Ch. 2 - CO and NO Emissions Exercise 5 lists the amounts...Ch. 2 - Sports Equipment According to USA Today, the...Ch. 2 - In Exercises 1-5, refer to the table in the...Ch. 2 - In Exercises 1-5, refer to the table in the...Ch. 2 - In Exercises 1-5, refer to the table in the...Ch. 2 - In Exercises 1-5, refer to the table in the...Ch. 2 - In Exercises 1-5, refer to the table in the...Ch. 2 - Grooming Time Listed below are times (minutes)...Ch. 2 - Histogram of Grooming Times Use the frequency...Ch. 2 - Stemplot of Grooming Times Use the data from...Ch. 2 - Technology Project It was noted in this section...Ch. 2 - Flight Planning Data Set 15 in Appendix B includes...Ch. 2 - Prob. 2FDDCh. 2 - Flight Planning Data Set 15 in Appendix B includes...
Knowledge Booster


Learn more about
Need a deep-dive on the concept behind this application? Look no further. Learn more about this topic, statistics and related others by exploring similar questions and additional content below.Similar questions
- 21. ANALYSIS OF LAST DIGITS Heights of statistics students were obtained by the author as part of an experiment conducted for class. The last digits of those heights are listed below. Construct a frequency distribution with 10 classes. Based on the distribution, do the heights appear to be reported or actually measured? Does there appear to be a gap in the frequencies and, if so, how might that gap be explained? What do you know about the accuracy of the results? 3 4 555 0 0 0 0 0 0 0 0 0 1 1 23 3 5 5 5 5 5 5 5 5 5 5 5 5 6 6 8 8 8 9arrow_forwardA side view of a recycling bin lid is diagramed below where two panels come together at a right angle. 45 in 24 in Width? — Given this information, how wide is the recycling bin in inches?arrow_forward1 No. 2 3 4 Binomial Prob. X n P Answer 5 6 4 7 8 9 10 12345678 8 3 4 2 2552 10 0.7 0.233 0.3 0.132 7 0.6 0.290 20 0.02 0.053 150 1000 0.15 0.035 8 7 10 0.7 0.383 11 9 3 5 0.3 0.132 12 10 4 7 0.6 0.290 13 Poisson Probability 14 X lambda Answer 18 4 19 20 21 22 23 9 15 16 17 3 1234567829 3 2 0.180 2 1.5 0.251 12 10 0.095 5 3 0.101 7 4 0.060 3 2 0.180 2 1.5 0.251 24 10 12 10 0.095arrow_forward
- step by step on Microssoft on how to put this in excel and the answers please Find binomial probability if: x = 8, n = 10, p = 0.7 x= 3, n=5, p = 0.3 x = 4, n=7, p = 0.6 Quality Control: A factory produces light bulbs with a 2% defect rate. If a random sample of 20 bulbs is tested, what is the probability that exactly 2 bulbs are defective? (hint: p=2% or 0.02; x =2, n=20; use the same logic for the following problems) Marketing Campaign: A marketing company sends out 1,000 promotional emails. The probability of any email being opened is 0.15. What is the probability that exactly 150 emails will be opened? (hint: total emails or n=1000, x =150) Customer Satisfaction: A survey shows that 70% of customers are satisfied with a new product. Out of 10 randomly selected customers, what is the probability that at least 8 are satisfied? (hint: One of the keyword in this question is “at least 8”, it is not “exactly 8”, the correct formula for this should be = 1- (binom.dist(7, 10, 0.7,…arrow_forwardKate, Luke, Mary and Nancy are sharing a cake. The cake had previously been divided into four slices (s1, s2, s3 and s4). What is an example of fair division of the cake S1 S2 S3 S4 Kate $4.00 $6.00 $6.00 $4.00 Luke $5.30 $5.00 $5.25 $5.45 Mary $4.25 $4.50 $3.50 $3.75 Nancy $6.00 $4.00 $4.00 $6.00arrow_forwardFaye cuts the sandwich in two fair shares to her. What is the first half s1arrow_forward
- Question 2. An American option on a stock has payoff given by F = f(St) when it is exercised at time t. We know that the function f is convex. A person claims that because of convexity, it is optimal to exercise at expiration T. Do you agree with them?arrow_forwardQuestion 4. We consider a CRR model with So == 5 and up and down factors u = 1.03 and d = 0.96. We consider the interest rate r = 4% (over one period). Is this a suitable CRR model? (Explain your answer.)arrow_forwardQuestion 3. We want to price a put option with strike price K and expiration T. Two financial advisors estimate the parameters with two different statistical methods: they obtain the same return rate μ, the same volatility σ, but the first advisor has interest r₁ and the second advisor has interest rate r2 (r1>r2). They both use a CRR model with the same number of periods to price the option. Which advisor will get the larger price? (Explain your answer.)arrow_forward
- Question 5. We consider a put option with strike price K and expiration T. This option is priced using a 1-period CRR model. We consider r > 0, and σ > 0 very large. What is the approximate price of the option? In other words, what is the limit of the price of the option as σ∞. (Briefly justify your answer.)arrow_forwardQuestion 6. You collect daily data for the stock of a company Z over the past 4 months (i.e. 80 days) and calculate the log-returns (yk)/(-1. You want to build a CRR model for the evolution of the stock. The expected value and standard deviation of the log-returns are y = 0.06 and Sy 0.1. The money market interest rate is r = 0.04. Determine the risk-neutral probability of the model.arrow_forwardSeveral markets (Japan, Switzerland) introduced negative interest rates on their money market. In this problem, we will consider an annual interest rate r < 0. We consider a stock modeled by an N-period CRR model where each period is 1 year (At = 1) and the up and down factors are u and d. (a) We consider an American put option with strike price K and expiration T. Prove that if <0, the optimal strategy is to wait until expiration T to exercise.arrow_forward
arrow_back_ios
SEE MORE QUESTIONS
arrow_forward_ios
Recommended textbooks for you
 Glencoe Algebra 1, Student Edition, 9780079039897...AlgebraISBN:9780079039897Author:CarterPublisher:McGraw Hill
 Holt Mcdougal Larson Pre-algebra: Student Edition...AlgebraISBN:9780547587776Author:HOLT MCDOUGALPublisher:HOLT MCDOUGAL
 Big Ideas Math A Bridge To Success Algebra 1: Stu...AlgebraISBN:9781680331141Author:HOUGHTON MIFFLIN HARCOURTPublisher:Houghton Mifflin Harcourt
 College Algebra (MindTap Course List)AlgebraISBN:9781305652231Author:R. David Gustafson, Jeff HughesPublisher:Cengage Learning
Glencoe Algebra 1, Student Edition, 9780079039897...
Algebra
ISBN:9780079039897
Author:Carter
Publisher:McGraw Hill
Holt Mcdougal Larson Pre-algebra: Student Edition...
Algebra
ISBN:9780547587776
Author:HOLT MCDOUGAL
Publisher:HOLT MCDOUGAL
Big Ideas Math A Bridge To Success Algebra 1: Stu...
Algebra
ISBN:9781680331141
Author:HOUGHTON MIFFLIN HARCOURT
Publisher:Houghton Mifflin Harcourt
College Algebra (MindTap Course List)
Algebra
ISBN:9781305652231
Author:R. David Gustafson, Jeff Hughes
Publisher:Cengage Learning
what is Research Design, Research Design Types, and Research Design Methods; Author: Educational Hub;https://www.youtube.com/watch?v=LpmGSioXxdo;License: Standard YouTube License, CC-BY