The bar graph gives the life expectancy for American men and women born in six selected years. In Exercises 90, you will use the date to abstain models for life expectancy and make predications about how long American men and woman will live in the future. Use the date for males shown in the bar graph at the bottom of the previous column to solve this exercise. a. Let x represent the number of birth years after 1960 and let y represent male life expectancy. Create a scatter plot that displays the date a set of six point in a rectangular coordinate system . b. Draw a line through the two points that show male life expectancies for 1980 and 2000. Use the create a scatter plot that displays the date as a set of six points in a rectangular coordinate system. c. Use the function form part (b) to project the life expectancy of American men born in 2020.
The bar graph gives the life expectancy for American men and women born in six selected years. In Exercises 90, you will use the date to abstain models for life expectancy and make predications about how long American men and woman will live in the future. Use the date for males shown in the bar graph at the bottom of the previous column to solve this exercise. a. Let x represent the number of birth years after 1960 and let y represent male life expectancy. Create a scatter plot that displays the date a set of six point in a rectangular coordinate system . b. Draw a line through the two points that show male life expectancies for 1980 and 2000. Use the create a scatter plot that displays the date as a set of six points in a rectangular coordinate system. c. Use the function form part (b) to project the life expectancy of American men born in 2020.
Solution Summary: The author explains how to determine the scatter plot and the linear function through the points that show female life expectancy.
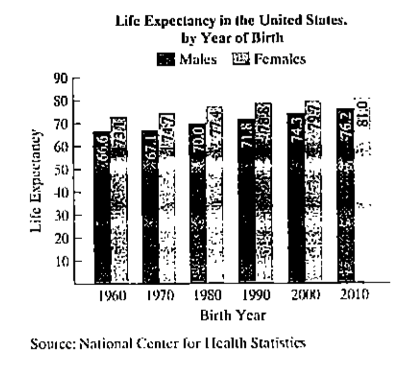
The bar graph gives the life expectancy for American men and women born in six selected years. In Exercises 90, you will use the date to abstain models for life expectancy and make predications about how long American men and woman will live in the future.
Use the date for males shown in the bar graph at the bottom of the previous column to solve this exercise.
a. Let x represent the number of birth years after 1960 and let y represent male life expectancy. Create a scatter plot that displays the date a set of six point in a rectangular coordinate system.
b. Draw a line through the two points that show male life expectancies for 1980 and 2000. Use the create a scatter plot that displays the date as a set of six points in a rectangular coordinate system.
c. Use the function form part (b) to project the life expectancy of American men born in 2020.
System that uses coordinates to uniquely determine the position of points. The most common coordinate system is the Cartesian system, where points are given by distance along a horizontal x-axis and vertical y-axis from the origin. A polar coordinate system locates a point by its direction relative to a reference direction and its distance from a given point. In three dimensions, it leads to cylindrical and spherical coordinates.
Need a deep-dive on the concept behind this application? Look no further. Learn more about this topic, algebra and related others by exploring similar questions and additional content below.
Discrete Distributions: Binomial, Poisson and Hypergeometric | Statistics for Data Science; Author: Dr. Bharatendra Rai;https://www.youtube.com/watch?v=lHhyy4JMigg;License: Standard Youtube License


 College Algebra (MindTap Course List)AlgebraISBN:9781305652231Author:R. David Gustafson, Jeff HughesPublisher:Cengage Learning
 Algebra: Structure And Method, Book 1AlgebraISBN:9780395977224Author:Richard G. Brown, Mary P. Dolciani, Robert H. Sorgenfrey, William L. ColePublisher:McDougal Littell
 Mathematics For Machine TechnologyAdvanced MathISBN:9781337798310Author:Peterson, John.Publisher:Cengage Learning,
 Holt Mcdougal Larson Pre-algebra: Student Edition...AlgebraISBN:9780547587776Author:HOLT MCDOUGALPublisher:HOLT MCDOUGAL
 Trigonometry (MindTap Course List)TrigonometryISBN:9781337278461Author:Ron LarsonPublisher:Cengage Learning