A pplication Exercises Americans are gettingmarried later in life or not getting married at all. In 2008, nearly half of Americans ages 25 through 29 were unmarried. The following bar graph shows the percentage of never-married men and women in this age group. The data ae displayed as two sets of four points each, one scatter plot for the percentage of never-married American men and one for the percentage of never-married American women. Also shown for each scatter plot is a line that passes through or near the four points. Use these lines to solve Exercises 87–88. In this exercise, you will use the red line for the men shown on the scatter plot to develop a model for the percentage of never-married American males ages 25–29. a. Use the two points whose coordinates are shown by the voice balloons to find the point-slope form of the equation of the line that models the percentage of never-married American males ages 25–29, y, x years after 1980. b. Write the equation from part (a) in slope-intercept form. Use function notation. c. Use the linear function to predict the percentage of never-married American males, ages 25–29, in 2015.
A pplication Exercises Americans are gettingmarried later in life or not getting married at all. In 2008, nearly half of Americans ages 25 through 29 were unmarried. The following bar graph shows the percentage of never-married men and women in this age group. The data ae displayed as two sets of four points each, one scatter plot for the percentage of never-married American men and one for the percentage of never-married American women. Also shown for each scatter plot is a line that passes through or near the four points. Use these lines to solve Exercises 87–88. In this exercise, you will use the red line for the men shown on the scatter plot to develop a model for the percentage of never-married American males ages 25–29. a. Use the two points whose coordinates are shown by the voice balloons to find the point-slope form of the equation of the line that models the percentage of never-married American males ages 25–29, y, x years after 1980. b. Write the equation from part (a) in slope-intercept form. Use function notation. c. Use the linear function to predict the percentage of never-married American males, ages 25–29, in 2015.
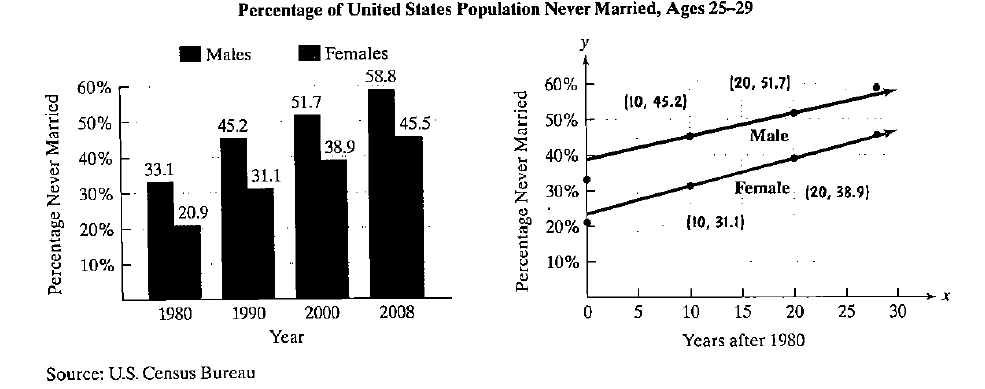
Americans are gettingmarried later in life or not getting married at all. In 2008, nearly half of Americans ages 25 through 29 were unmarried. The following bar graph shows the percentage of never-married men and women in this age group. The data ae displayed as two sets of four points each, one scatter plot for the percentage of never-married American men and one for the percentage of never-married American women. Also shown for each scatter plot is a line that passes through or near the four points. Use these lines to solve Exercises 87–88.
In this exercise, you will use the red line for the men shown on the scatter plot to develop a model for the percentage of never-married American males ages 25–29.
a. Use the two points whose coordinates are shown by the voice balloons to find the point-slope form of the equation of the line that models the percentage of never-married American males ages 25–29, y, x years after 1980.
b. Write the equation from part (a) in slope-intercept form. Use function notation.
c. Use the linear function to predict the percentage of never-married American males, ages 25–29, in 2015.
Formula Formula Point-slope equation: The point-slope equation of a line passing through the point (x 1 , y 1 ) with slope m , is given by the following formula: y - y 1 = m x - x 1 Example: The point-slope equation of a line passing through (2, -6) with slope 5 is given by: y - (-6) = 5(x - 2) y + 6 = 5(x - 2)
A research study in the year 2009 found that there were 2760 coyotes
in a given region. The coyote population declined at a rate of 5.8%
each year.
How many fewer coyotes were there in 2024 than in 2015?
Explain in at least one sentence how you solved the problem. Show
your work. Round your answer to the nearest whole number.
Answer the following questions related to the following matrix
A =
3
³).
Explain the following terms
Chapter 2 Solutions
College Algebra, Books a la Carte Edition Plus NEW MyMathLab -- Access Card Package (6th Edition)
Need a deep-dive on the concept behind this application? Look no further. Learn more about this topic, algebra and related others by exploring similar questions and additional content below.
Which is the best chart: Selecting among 14 types of charts Part II; Author: 365 Data Science;https://www.youtube.com/watch?v=qGaIB-bRn-A;License: Standard YouTube License, CC-BY


 Glencoe Algebra 1, Student Edition, 9780079039897...AlgebraISBN:9780079039897Author:CarterPublisher:McGraw Hill
 Holt Mcdougal Larson Pre-algebra: Student Edition...AlgebraISBN:9780547587776Author:HOLT MCDOUGALPublisher:HOLT MCDOUGAL
 Functions and Change: A Modeling Approach to Coll...AlgebraISBN:9781337111348Author:Bruce Crauder, Benny Evans, Alan NoellPublisher:Cengage Learning
 Big Ideas Math A Bridge To Success Algebra 1: Stu...AlgebraISBN:9781680331141Author:HOUGHTON MIFFLIN HARCOURTPublisher:Houghton Mifflin Harcourt