
Elementary Statistics: Picturing the World (6th Edition)
6th Edition
ISBN: 9780321911216
Author: Ron Larson, Betsy Farber
Publisher: PEARSON
expand_more
expand_more
format_list_bulleted
Videos
Textbook Question
Chapter 2.3, Problem 56E
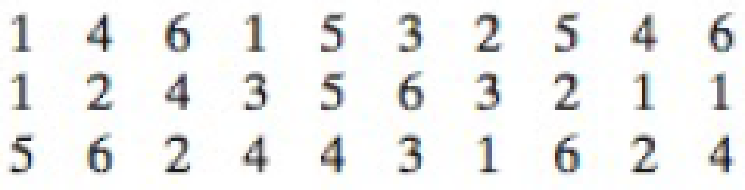
Identifying the Shape of a Distribution In Exercises 53–56, construct a frequency distribution and a frequency histogram for the data set using the indicated number of classes. Describe the shape of the histogram as symmetric, uniform, negatively skewed, positively skewed, or none of these.
56. Six-Sided Die
Number of classes: 6
Data set: The results of rolling a six-sided die 30 times
Expert Solution & Answer
Want to see the full answer?
Check out a sample textbook solution
Students have asked these similar questions
Business Discuss
The following data represent total ventilation measured in liters of air per minute per square meter of body area for two independent (and randomly chosen) samples.
Analyze these data using the appropriate non-parametric hypothesis test
each column represents before & after measurements on the same individual. Analyze with the appropriate non-parametric hypothesis test for a paired design.
Chapter 2 Solutions
Elementary Statistics: Picturing the World (6th Edition)
Ch. 2.1 - Prob. 1TYCh. 2.1 - Prob. 2TYCh. 2.1 - Prob. 3TYCh. 2.1 - Prob. 4TYCh. 2.1 - Prob. 5TYCh. 2.1 - Prob. 6TYCh. 2.1 - Prob. 7TYCh. 2.1 - What are some benefits of representing data sets...Ch. 2.1 - Why should the number of classes in a frequency...Ch. 2.1 - What is the difference between class limits and...
Ch. 2.1 - What is the difference between relative frequency...Ch. 2.1 - After constructing an expanded frequency...Ch. 2.1 - What is the difference between a frequency polygon...Ch. 2.1 - True or False? In Exercises 710, determine whether...Ch. 2.1 - True or False? In Exercises 710, determine whether...Ch. 2.1 - True or False? In Exercises 710, determine whether...Ch. 2.1 - Prob. 10ECh. 2.1 - In Exercises 1114, use the minimum and maximum...Ch. 2.1 - In Exercises 1114, use the minimum and maximum...Ch. 2.1 - In Exercises 1114, use the minimum and maximum...Ch. 2.1 - In Exercises 1114, use the minimum and maximum...Ch. 2.1 - Reading a Frequency Distribution In Exercises 15...Ch. 2.1 - Prob. 15ECh. 2.1 - Prob. 17ECh. 2.1 - Prob. 18ECh. 2.1 - Prob. 19ECh. 2.1 - Prob. 20ECh. 2.1 - Prob. 21ECh. 2.1 - Prob. 22ECh. 2.1 - Prob. 23ECh. 2.1 - Prob. 24ECh. 2.1 - Prob. 25ECh. 2.1 - Prob. 26ECh. 2.1 - Prob. 27ECh. 2.1 - Prob. 28ECh. 2.1 - Prob. 29ECh. 2.1 - Prob. 30ECh. 2.1 - Prob. 31ECh. 2.1 - Constructing a Frequency Distribution and a...Ch. 2.1 - Constructing a Frequency Distribution and a...Ch. 2.1 - Prob. 34ECh. 2.1 - Prob. 35ECh. 2.1 - Prob. 36ECh. 2.1 - Prob. 37ECh. 2.1 - Prob. 38ECh. 2.1 - Prob. 39ECh. 2.1 - Prob. 40ECh. 2.1 - Prob. 41ECh. 2.1 - Prob. 42ECh. 2.1 - In Exercises 43 and 44, use the data set and the...Ch. 2.1 - Prob. 44ECh. 2.1 - What Would You Do? You work at a bank and are...Ch. 2.1 - Prob. 46ECh. 2.1 - Prob. 47ECh. 2.2 - Prob. 1TYCh. 2.2 - Prob. 2TYCh. 2.2 - Prob. 3TYCh. 2.2 - Prob. 4TYCh. 2.2 - Prob. 5TYCh. 2.2 - Prob. 6TYCh. 2.2 - Prob. 7TYCh. 2.2 - Name some ways to display quantitative data...Ch. 2.2 - What is an advantage of using a stem-and-leaf plot...Ch. 2.2 - In terms of displaying data, how is a...Ch. 2.2 - How is a Pareto chart different from a standard...Ch. 2.2 - Putting Graphs in Context In Exercises 58, match...Ch. 2.2 - Putting Graphs in Context In Exercises 58, match...Ch. 2.2 - Putting Graphs in Context In Exercises 58, match...Ch. 2.2 - Putting Graphs in Context In Exercises 58, match...Ch. 2.2 - Graphical Analysis In Exercises 912, use the...Ch. 2.2 - Graphical Analysis In Exercises 912, use the...Ch. 2.2 - Graphical Analysis In Exercises 912, use the...Ch. 2.2 - Prob. 12ECh. 2.2 - Prob. 13ECh. 2.2 - Prob. 14ECh. 2.2 - Prob. 15ECh. 2.2 - Prob. 16ECh. 2.2 - Graphing Data Sets In Exercises 1732, organize the...Ch. 2.2 - Graphing Data Sets In Exercises 1732, organize the...Ch. 2.2 - Prob. 19ECh. 2.2 - Prob. 20ECh. 2.2 - Prob. 21ECh. 2.2 - Prob. 22ECh. 2.2 - Prob. 23ECh. 2.2 - Graphing Data Sets In Exercises 1732, organize the...Ch. 2.2 - Prob. 25ECh. 2.2 - Prob. 26ECh. 2.2 - Prob. 27ECh. 2.2 - Prob. 28ECh. 2.2 - Hourly Wages Use a scatter plot to display the...Ch. 2.2 - Salaries Use a scatter plot to display the data...Ch. 2.2 - Prob. 31ECh. 2.2 - Prob. 32ECh. 2.2 - Prob. 33ECh. 2.2 - Prob. 34ECh. 2.2 - Prob. 35ECh. 2.2 - Favorite Day of the Week Display the data below in...Ch. 2.2 - A Misleading Graph? A misleading graph is not...Ch. 2.2 - Prob. 38ECh. 2.2 - A Misleading Graph? A misleading graph is not...Ch. 2.2 - Prob. 40ECh. 2.2 - Prob. 41ECh. 2.2 - Prob. 42ECh. 2.3 - Find the mean of the points scored by the 51...Ch. 2.3 - Find the median of the points scored by the 51...Ch. 2.3 - The points scored by the winning teams in the...Ch. 2.3 - Find the mode of the points scored by the 51...Ch. 2.3 - In a survey, 1534 adults were asked, How much do...Ch. 2.3 - Remove the data entry 65 from the data set in...Ch. 2.3 - In Example 7, your grade in the two-credit course...Ch. 2.3 - Use a frequency distribution to estimate the mean...Ch. 2.3 - True or False? In Exercises 14, determine whether...Ch. 2.3 - True or False? In Exercises 14, determine whether...Ch. 2.3 - True or False? In Exercises 14, determine whether...Ch. 2.3 - True or False? In Exercises 14, determine whether...Ch. 2.3 - Constructing Data Sets In Exercises 58, construct...Ch. 2.3 - Constructing Data Sets In Exercises 58, construct...Ch. 2.3 - Mean is not representative of a typical number in...Ch. 2.3 - Prob. 8ECh. 2.3 - Graphical Analysis In Exercises 912, determine...Ch. 2.3 - Graphical Analysis In Exercises 912, determine...Ch. 2.3 - Graphical Analysis In Exercises 912, determine...Ch. 2.3 - Graphical Analysis In Exercises 912, determine...Ch. 2.3 - Graphical Analysis In Exercises 912, determine...Ch. 2.3 - Prob. 14ECh. 2.3 - Graphical Analysis In Exercises 912, determine...Ch. 2.3 - Graphical Analysis In Exercises 912, determine...Ch. 2.3 - Prob. 17ECh. 2.3 - Finding and Discussing the Mean, Median, and Mode...Ch. 2.3 - Prob. 19ECh. 2.3 - Prob. 20ECh. 2.3 - Prob. 21ECh. 2.3 - Finding and Discussing the Mean, Median, and Mode...Ch. 2.3 - Prob. 23ECh. 2.3 - Prob. 24ECh. 2.3 - Prob. 25ECh. 2.3 - Finding and Discussing the Mean, Median, and Mode...Ch. 2.3 - Finding and Discussing the Mean, Median, and Mode...Ch. 2.3 - Prob. 28ECh. 2.3 - Prob. 29ECh. 2.3 - Finding and Discussing the Mean, Median, and Mode...Ch. 2.3 - Prob. 31ECh. 2.3 - Finding and Discussing the Mean, Median, and Mode...Ch. 2.3 - Finding and Discussing the Mean, Median, and Mode...Ch. 2.3 - Prob. 34ECh. 2.3 - Prob. 35ECh. 2.3 - Prob. 36ECh. 2.3 - Prob. 37ECh. 2.3 - In Exercises 3740, without performing any...Ch. 2.3 - In Exercises 3740, without performing any...Ch. 2.3 - In Exercises 3740, without performing any...Ch. 2.3 - Prob. 41ECh. 2.3 - Prob. 42ECh. 2.3 - Finding a Weighted Mean In Exercises 4146, find...Ch. 2.3 - Prob. 44ECh. 2.3 - Prob. 45ECh. 2.3 - Prob. 46ECh. 2.3 - Prob. 47ECh. 2.3 - Prob. 48ECh. 2.3 - Prob. 49ECh. 2.3 - Prob. 50ECh. 2.3 - Prob. 51ECh. 2.3 - Prob. 52ECh. 2.3 - Prob. 53ECh. 2.3 - Prob. 54ECh. 2.3 - Identifying the Shape of a Distribution In...Ch. 2.3 - Identifying the Shape of a Distribution In...Ch. 2.3 - Prob. 57ECh. 2.3 - Prob. 58ECh. 2.3 - Prob. 59ECh. 2.3 - Prob. 60ECh. 2.3 - Prob. 61ECh. 2.3 - Prob. 62ECh. 2.3 - Prob. 63ECh. 2.3 - Prob. 64ECh. 2.3 - Data Analysis Students in an experimental...Ch. 2.3 - Trimmed Mean To find the 10% trimmed mean of a...Ch. 2.3 - Specify the lower limit to be 1 and the upper...Ch. 2.3 - Specify the lower limit to be 0 and the upper...Ch. 2.4 - Prob. 1TYCh. 2.4 - Prob. 2TYCh. 2.4 - Prob. 3TYCh. 2.4 - Prob. 4TYCh. 2.4 - Prob. 5TYCh. 2.4 - Prob. 6TYCh. 2.4 - Prob. 7TYCh. 2.4 - Prob. 8TYCh. 2.4 - Prob. 9TYCh. 2.4 - Prob. 10TYCh. 2.4 - Explain how to find the range of a data set. What...Ch. 2.4 - Explain how to find the deviation of an entry in a...Ch. 2.4 - Why is the standard deviation used more frequently...Ch. 2.4 - Explain the relationship between variance and...Ch. 2.4 - Describe the difference between the calculation of...Ch. 2.4 - Given a data set. how do you know whether to...Ch. 2.4 - Discuss the similarities and the differences...Ch. 2.4 - What must you know about a data set before you can...Ch. 2.4 - Prob. 9ECh. 2.4 - Finding the Range of a Data Set In Exercises 9 and...Ch. 2.4 - Archaeology The depths (in inches) at which 10...Ch. 2.4 - In Exercise 11, compare your answer to part (a)...Ch. 2.4 - Prob. 13ECh. 2.4 - Prob. 14ECh. 2.4 - Prob. 15ECh. 2.4 - Prob. 16ECh. 2.4 - Estimating Standard Deviation Both data sets shown...Ch. 2.4 - Estimating Standard Deviation Both data sets shown...Ch. 2.4 - Prob. 19ECh. 2.4 - Prob. 20ECh. 2.4 - Prob. 21ECh. 2.4 - Prob. 22ECh. 2.4 - Prob. 23ECh. 2.4 - Prob. 24ECh. 2.4 - Constructing Data Sets In Exercises 2528,...Ch. 2.4 - Constructing Data Sets In Exercises 2528,...Ch. 2.4 - Constructing Data Sets In Exercises 2528,...Ch. 2.4 - Constructing Data Sets In Exercises 2528,...Ch. 2.4 - Using the Empirical Rule In Exercises 2934, use...Ch. 2.4 - Using the Empirical Rule In Exercises 2934, use...Ch. 2.4 - Using the Empirical Rule In Exercises 2934, use...Ch. 2.4 - Using the Empirical Rule In Exercises 2934, use...Ch. 2.4 - Using the Empirical Rule In Exercises 2934, use...Ch. 2.4 - Using the Empirical Rule In Exercises 2934, use...Ch. 2.4 - Using Chebychevs Theorem You are conducting a...Ch. 2.4 - Prob. 36ECh. 2.4 - Prob. 37ECh. 2.4 - Prob. 38ECh. 2.4 - Prob. 39ECh. 2.4 - Estimating the Sample Mean and Standard Deviation...Ch. 2.4 - Estimating the Sample Mean and Standard Deviation...Ch. 2.4 - Prob. 42ECh. 2.4 - Prob. 43ECh. 2.4 - Prob. 44ECh. 2.4 - Prob. 45ECh. 2.4 - Prob. 46ECh. 2.4 - Prob. 47ECh. 2.4 - Prob. 48ECh. 2.4 - Prob. 49ECh. 2.4 - Prob. 50ECh. 2.4 - Prob. 51ECh. 2.4 - Prob. 52ECh. 2.4 - Prob. 53ECh. 2.4 - Prob. 54ECh. 2.4 - Specify the lower limit to be 10 and the upper...Ch. 2.4 - Specify the lower limit to be 30 and the upper...Ch. 2.4 - Prob. 1CSCh. 2.4 - Prob. 2CSCh. 2.4 - Prob. 3CSCh. 2.4 - Prob. 4CSCh. 2.4 - Prob. 5CSCh. 2.4 - Prob. 6CSCh. 2.5 - Prob. 1TYCh. 2.5 - Prob. 2TYCh. 2.5 - Prob. 3TYCh. 2.5 - Prob. 4TYCh. 2.5 - Prob. 5TYCh. 2.5 - Prob. 6TYCh. 2.5 - Prob. 7TYCh. 2.5 - Prob. 8TYCh. 2.5 - Prob. 1ECh. 2.5 - Prob. 2ECh. 2.5 - Prob. 3ECh. 2.5 - Prob. 4ECh. 2.5 - Explain how to identify outliers using the...Ch. 2.5 - Describe the relationship between quartiles and...Ch. 2.5 - True or False? In Exercises 710, determine whether...Ch. 2.5 - True or False? In Exercises 710, determine whether...Ch. 2.5 - True or False? In Exercises 710, determine whether...Ch. 2.5 - True or False? In Exercises 710, determine whether...Ch. 2.5 - Finding Quartiles, Interquartile Range, and...Ch. 2.5 - Prob. 12ECh. 2.5 - Prob. 13ECh. 2.5 - Prob. 14ECh. 2.5 - Prob. 15ECh. 2.5 - Prob. 16ECh. 2.5 - Drawing a Box-and-Whisker Plot In Exercises 1518,...Ch. 2.5 - Drawing a Box-and-Whisker Plot In Exercises 1518,...Ch. 2.5 - Drawing a Box-and-Whisker Plot In Exercises 1518,...Ch. 2.5 - Prob. 20ECh. 2.5 - Graphical Analysis In Exercises 1922, use the...Ch. 2.5 - Graphical Analysis In Exercises 1922, use the...Ch. 2.5 - Graphical Analysis In Exercises 1922, use the...Ch. 2.5 - Graphical Analysis In Exercises 1922, use the...Ch. 2.5 - Prob. 25ECh. 2.5 - Using Technology to Find Quartiles and Draw Graphs...Ch. 2.5 - Prob. 27ECh. 2.5 - Prob. 28ECh. 2.5 - Prob. 29ECh. 2.5 - Prob. 30ECh. 2.5 - Prob. 31ECh. 2.5 - Prob. 32ECh. 2.5 - Prob. 33ECh. 2.5 - Prob. 34ECh. 2.5 - Finding a Percentile In Exercises 3336, use the...Ch. 2.5 - Finding a Percentile In Exercises 3336, use the...Ch. 2.5 - Finding a Percentile In Exercises 3336, use the...Ch. 2.5 - Finding a Percentile In Exercises 3336, use the...Ch. 2.5 - Prob. 39ECh. 2.5 - Prob. 40ECh. 2.5 - Prob. 41ECh. 2.5 - Prob. 42ECh. 2.5 - Prob. 43ECh. 2.5 - Prob. 44ECh. 2.5 - Prob. 45ECh. 2.5 - Prob. 46ECh. 2.5 - Life Spans of Tires A brand of automobile tire has...Ch. 2.5 - Life Spans of Fruit Flies The life spans of a...Ch. 2.5 - Prob. 49ECh. 2.5 - Prob. 50ECh. 2.5 - Prob. 51ECh. 2.5 - Prob. 52ECh. 2.5 - Prob. 53ECh. 2.5 - Prob. 54ECh. 2.5 - Song Lengths Side-by-side box-and-whisker plots...Ch. 2.5 - Credit Card Purchases The credit card purchases...Ch. 2.5 - Modified Box-and-Whisker Plot In Exercises 5962,...Ch. 2.5 - Modified Box-and-Whisker Plot In Exercises 5962,...Ch. 2 - Prob. 2.1.1RECh. 2 - Prob. 2.1.2RECh. 2 - Prob. 2.1.3RECh. 2 - Prob. 2.1.4RECh. 2 - Prob. 2.1.5RECh. 2 - Prob. 2.1.6RECh. 2 - Prob. 2.2.7RECh. 2 - Prob. 2.2.8RECh. 2 - Prob. 2.2.9RECh. 2 - Prob. 2.2.10RECh. 2 - Prob. 2.2.11RECh. 2 - Prob. 2.2.12RECh. 2 - Prob. 2.3.13RECh. 2 - Prob. 2.3.14RECh. 2 - For the six test scores 78, 72, 86, 91, 87, and...Ch. 2 - For the four test scores 96, 85, 91, and 86, the...Ch. 2 - Estimate the mean of the frequency distribution...Ch. 2 - The frequency distribution shows the numbers of...Ch. 2 - Prob. 2.3.19RECh. 2 - Prob. 2.3.20RECh. 2 - In Exercises 21 and 22, determine whether the...Ch. 2 - In Exercises 21 and 22, determine whether the...Ch. 2 - Prob. 2.3.23RECh. 2 - For the histogram in Exercise 21, which is...Ch. 2 - In Exercises 25 and 26, find the range, mean,...Ch. 2 - Prob. 2.4.26RECh. 2 - Prob. 2.4.27RECh. 2 - Prob. 2.4.28RECh. 2 - Prob. 2.4.29RECh. 2 - Prob. 2.4.30RECh. 2 - Prob. 2.4.31RECh. 2 - Prob. 2.4.32RECh. 2 - From a random sample of households, the numbers of...Ch. 2 - From a random sample of airplanes, the numbers of...Ch. 2 - In Exercises 35 and 36, find the coefficient of...Ch. 2 - Prob. 2.4.36RECh. 2 - Prob. 2.5.37RECh. 2 - Prob. 2.5.38RECh. 2 - Prob. 2.5.39RECh. 2 - Prob. 2.5.40RECh. 2 - Prob. 2.5.41RECh. 2 - Prob. 2.5.42RECh. 2 - A students test grade of 75 represents the 65th...Ch. 2 - Prob. 2.5.44RECh. 2 - Prob. 2.5.45RECh. 2 - Prob. 2.5.46RECh. 2 - Prob. 2.5.47RECh. 2 - Prob. 2.5.48RECh. 2 - Prob. 1CQCh. 2 - Prob. 2CQCh. 2 - Prob. 3CQCh. 2 - Prob. 4CQCh. 2 - Prob. 5CQCh. 2 - Prob. 6CQCh. 2 - Prob. 7CQCh. 2 - Prob. 1CTCh. 2 - Prob. 2CTCh. 2 - Prob. 3CTCh. 2 - Prob. 4CTCh. 2 - Prob. 5CTCh. 2 - Prob. 6CTCh. 2 - Prob. 7CTCh. 2 - Prob. 8CTCh. 2 - Prob. 1RSRDCh. 2 - Prob. 2RSRDCh. 2 - Prob. 3RSRDCh. 2 - Prob. 1TCh. 2 - Prob. 2TCh. 2 - Prob. 3TCh. 2 - Prob. 4TCh. 2 - Prob. 5TCh. 2 - Prob. 6TCh. 2 - Prob. 7TCh. 2 - Prob. 8TCh. 2 - Prob. 9TCh. 2 - Prob. 10TCh. 2 - In Exercices 1 and 2, identify the sampling...Ch. 2 - Prob. 2CRCh. 2 - Prob. 3CRCh. 2 - Prob. 4CRCh. 2 - Prob. 5CRCh. 2 - Prob. 6CRCh. 2 - Prob. 7CRCh. 2 - Prob. 8CRCh. 2 - Prob. 9CRCh. 2 - Prob. 10CRCh. 2 - Prob. 11CRCh. 2 - Prob. 12CRCh. 2 - Prob. 13CRCh. 2 - Prob. 14CRCh. 2 - Tail lengths (in feet) for a sample of American...Ch. 2 - Prob. 16CRCh. 2 - Prob. 17CRCh. 2 - Prob. 18CRCh. 2 - Prob. 19CR
Knowledge Booster


Learn more about
Need a deep-dive on the concept behind this application? Look no further. Learn more about this topic, statistics and related others by exploring similar questions and additional content below.Similar questions
- Should you be confident in applying your regression equation to estimate the heart rate of a python at 35°C? Why or why not?arrow_forwardGiven your fitted regression line, what would be the residual for snake #5 (10 C)?arrow_forwardCalculate the 95% confidence interval around your estimate of r using Fisher’s z-transformation. In your final answer, make sure to back-transform to the original units.arrow_forward
- BUSINESS DISCUSSarrow_forwardA researcher wishes to estimate, with 90% confidence, the population proportion of adults who support labeling legislation for genetically modified organisms (GMOs). Her estimate must be accurate within 4% of the true proportion. (a) No preliminary estimate is available. Find the minimum sample size needed. (b) Find the minimum sample size needed, using a prior study that found that 65% of the respondents said they support labeling legislation for GMOs. (c) Compare the results from parts (a) and (b). ... (a) What is the minimum sample size needed assuming that no prior information is available? n = (Round up to the nearest whole number as needed.)arrow_forwardThe table available below shows the costs per mile (in cents) for a sample of automobiles. At a = 0.05, can you conclude that at least one mean cost per mile is different from the others? Click on the icon to view the data table. Let Hss, HMS, HLS, Hsuv and Hмy represent the mean costs per mile for small sedans, medium sedans, large sedans, SUV 4WDs, and minivans respectively. What are the hypotheses for this test? OA. Ho: Not all the means are equal. Ha Hss HMS HLS HSUV HMV B. Ho Hss HMS HLS HSUV = μMV Ha: Hss *HMS *HLS*HSUV * HMV C. Ho Hss HMS HLS HSUV =μMV = = H: Not all the means are equal. D. Ho Hss HMS HLS HSUV HMV Ha Hss HMS HLS =HSUV = HMVarrow_forward
arrow_back_ios
SEE MORE QUESTIONS
arrow_forward_ios
Recommended textbooks for you
 Big Ideas Math A Bridge To Success Algebra 1: Stu...AlgebraISBN:9781680331141Author:HOUGHTON MIFFLIN HARCOURTPublisher:Houghton Mifflin Harcourt
 Glencoe Algebra 1, Student Edition, 9780079039897...AlgebraISBN:9780079039897Author:CarterPublisher:McGraw Hill
 Holt Mcdougal Larson Pre-algebra: Student Edition...AlgebraISBN:9780547587776Author:HOLT MCDOUGALPublisher:HOLT MCDOUGAL
Big Ideas Math A Bridge To Success Algebra 1: Stu...
Algebra
ISBN:9781680331141
Author:HOUGHTON MIFFLIN HARCOURT
Publisher:Houghton Mifflin Harcourt
Glencoe Algebra 1, Student Edition, 9780079039897...
Algebra
ISBN:9780079039897
Author:Carter
Publisher:McGraw Hill
Holt Mcdougal Larson Pre-algebra: Student Edition...
Algebra
ISBN:9780547587776
Author:HOLT MCDOUGAL
Publisher:HOLT MCDOUGAL
Chi Square test; Author: Vectors Academy;https://www.youtube.com/watch?v=f53nXHoMXx4;License: Standard YouTube License, CC-BY