
Statistics: The Art and Science of Learning from Data (4th Edition)
4th Edition
ISBN: 9780321997838
Author: Alan Agresti, Christine A. Franklin, Bernhard Klingenberg
Publisher: PEARSON
expand_more
expand_more
format_list_bulleted
Videos
Textbook Question
Chapter 2.3, Problem 41PB
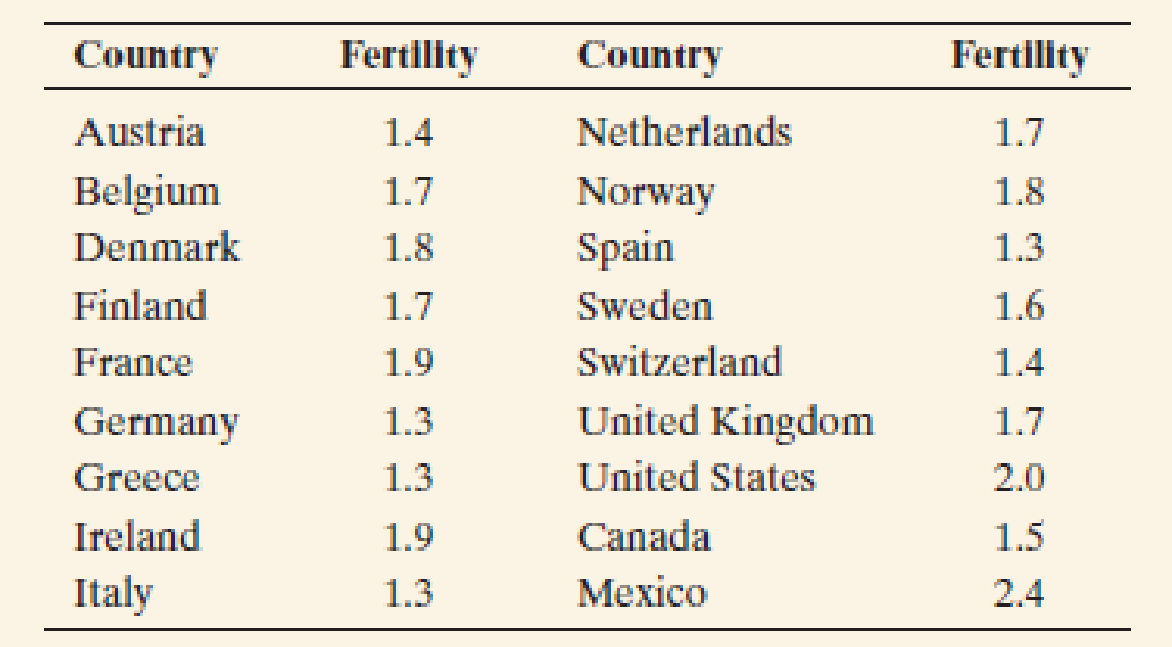
European fertility The European fertility rates (mean number of children per adult woman) from Exercise 2.18 are shown again in the table.
- a. Find the
median of the fertility rates. Interpret. - b. Find the mean of the fertility rates. Interpret.
- c. For each woman, the number of children is a whole number, such as 2 or 3. Explain why it makes sense to measure a mean number of children per adult woman (which is not a whole number) to compare fertility levels, such as the fertility levels of 1.5 in Canada and 2.4 in Mexico.
Expert Solution & Answer
Want to see the full answer?
Check out a sample textbook solution
Students have asked these similar questions
1. Define probability:
2. Define statistics:
Results of tossing a coin four times: H, H, H, H
How many times is the Coin expected to come up heads? How did you determine this number?
Calculate the % deviation.
Can these results be used to conclude that a coin is not fair? Why or why not?
Cycles to
failure
Position in
ascending
order
0.5
f(x))
(x;)
Problem 44
Marsha, a renowned cake scientist, is trying to determine how long different cakes can survive intense fork attacks before collapsing into crumbs.
To simulate real-world cake consumption, she designs a test where cakes are subjected to repeated fork stabs and bites, mimicking the brutal
reality of birthday parties. After rigorous testing, Marsha records 10 observations of how many stabs each cake endured before structural failure.
Construct P-P plots for (a.) a normal distribution, (b.) a lognormal distribution, and (c.) a Weibull distribution (using the information included in the
table below). Which distribution seems to be the best model for the cycles to failure for this material? Explain your answer in detail.
Observation
Empirical
cumulative
Probability distribution
Cumulative distribution
Inverse of cumulative
distribution F-1 (-0.5)
F(x))
(S)
n
4
3
1
0.05
9
5
2
0.15
7
7
3
0.25
1
10
4
0.35
3
12
5
0.45
Normal…
Chapter 2 Solutions
Statistics: The Art and Science of Learning from Data (4th Edition)
Ch. 2.1 - Categorical/quantitative difference a. Explain the...Ch. 2.1 - U.S. married-couple households According to a...Ch. 2.1 - Identify the variable type Identify each of the...Ch. 2.1 - Categorical or quantitative? Identify each of the...Ch. 2.1 - Discrete/continuous a. Explain the difference...Ch. 2.1 - Discrete or continuous? Identify each of the...Ch. 2.1 - Discrete or continuous 2 Repeat the previous...Ch. 2.1 - Prob. 8PBCh. 2.1 - Fatal Shark Attacks Few of the shark attacks...Ch. 2.2 - Generating Electricity In 2012 in the United...
Ch. 2.2 - What do alligators eat? The bar chart is from a...Ch. 2.2 - Prob. 12PBCh. 2.2 - Prob. 13PBCh. 2.2 - Prob. 14PBCh. 2.2 - Sugar dot plot For the breakfast cereal data given...Ch. 2.2 - Prob. 16PBCh. 2.2 - Graphing exam scores A teacher shows her class the...Ch. 2.2 - Fertility rates The fertility rate for a nation is...Ch. 2.2 - Split Stems The figure below shows the...Ch. 2.2 - Histogram for sugar For the breakfast cereal data,...Ch. 2.2 - Prob. 21PBCh. 2.2 - Prob. 22PBCh. 2.2 - Prob. 23PBCh. 2.2 - Prob. 24PBCh. 2.2 - Prob. 25PBCh. 2.2 - Prob. 26PBCh. 2.2 - Prob. 27PBCh. 2.2 - Warming in Newnan, Georgia? Access the Newnan, GA...Ch. 2.3 - Median versus mean For each of the following...Ch. 2.3 - Prob. 30PBCh. 2.3 - Prob. 31PBCh. 2.3 - Resistance to an outlier Consider the following...Ch. 2.3 - Income and health insurance According to the U.S....Ch. 2.3 - Prob. 34PBCh. 2.3 - Prob. 35PBCh. 2.3 - Prob. 36PBCh. 2.3 - Public transportationcenter The owner of a company...Ch. 2.3 - Prob. 38PBCh. 2.3 - Prob. 39PBCh. 2.3 - European fertility The European fertility rates...Ch. 2.3 - Sex partners A recent General Social Survey asked...Ch. 2.3 - Prob. 43PBCh. 2.3 - Prob. 44PBCh. 2.3 - Prob. 45PBCh. 2.4 - Sick leave A company decides to investigate the...Ch. 2.4 - Prob. 47PBCh. 2.4 - Prob. 48PBCh. 2.4 - Prob. 49PBCh. 2.4 - Exam standard deviation For an exam given to a...Ch. 2.4 - Heights For the sample heights of Georgia college...Ch. 2.4 - Histograms and standard deviation The figure shows...Ch. 2.4 - Female strength The High School Female Athletes...Ch. 2.4 - Female body weight The College Athletes data file...Ch. 2.4 - Shape of cigarette taxes A recent summary for the...Ch. 2.4 - Empirical rule and skewed, highly discrete...Ch. 2.4 - How much TV? The 2012 General Social Survey asked,...Ch. 2.4 - How many friends? A recent General Social Survey...Ch. 2.4 - Judging skew using x and s If the largest...Ch. 2.4 - Youth unemployment in the EU The Youth...Ch. 2.4 - Create data with a given standard deviation Use...Ch. 2.5 - Vacation days National Geographic Traveler...Ch. 2.5 - Youth unemployment In recent years, many European...Ch. 2.5 - Female strength The High School Female Athletes...Ch. 2.5 - Female body weight The College Athletes data file...Ch. 2.5 - Ways to measure variability The standard...Ch. 2.5 - Variability of cigarette taxes Heres the...Ch. 2.5 - Prob. 68PBCh. 2.5 - Infant mortality Africa The Human Development...Ch. 2.5 - Prob. 70PBCh. 2.5 - Computer use During a recent semester at the...Ch. 2.5 - Central Park temperature distribution revisited...Ch. 2.5 - Box plot for exam The scores on an exam have mean...Ch. 2.5 - Public transportation Exercise 2.37 described a...Ch. 2.5 - Prob. 75PBCh. 2.5 - Prob. 76PBCh. 2.5 - Prob. 77PBCh. 2.5 - Prob. 78PBCh. 2.5 - Prob. 79PBCh. 2.5 - Prob. 80PBCh. 2.5 - Prob. 81PBCh. 2.5 - Prob. 82PBCh. 2.6 - Great pay (on the average) The six full-time...Ch. 2.6 - Prob. 84PBCh. 2.6 - Prob. 85PBCh. 2.6 - Terrorism and war in Iraq In 2004, a college...Ch. 2.6 - Prob. 87PBCh. 2.6 - Prob. 88PBCh. 2 - Categorical or quantitative? Identify each of the...Ch. 2 - Continuous or discrete? Which of the following...Ch. 2 - Prob. 92CPCh. 2 - Cool in China A recent survey8 asked 1200...Ch. 2 - Prob. 94CPCh. 2 - Prob. 95CPCh. 2 - Prob. 96CPCh. 2 - Prob. 97CPCh. 2 - Prob. 98CPCh. 2 - Prob. 99CPCh. 2 - Prob. 100CPCh. 2 - Prob. 101CPCh. 2 - Prob. 103CPCh. 2 - Household net worth A study reported that in 2007...Ch. 2 - Prob. 105CPCh. 2 - Prob. 106CPCh. 2 - Prob. 107CPCh. 2 - Central Park monthly temperatures The MINITAB...Ch. 2 - Prob. 109CPCh. 2 - Female heights According to a recent report from...Ch. 2 - Energy and water consumption In parts a and b,...Ch. 2 - Prob. 112CPCh. 2 - More hurricane damage Refer to the previous...Ch. 2 - Prob. 114CPCh. 2 - Prob. 115CPCh. 2 - Prob. 116CPCh. 2 - Prob. 117CPCh. 2 - Temperatures in Central Park Access the Central...Ch. 2 - Teachers salaries According to Statistical...Ch. 2 - Prob. 120CPCh. 2 - What box plot do you expect? For each of the...Ch. 2 - Prob. 122CPCh. 2 - Prob. 123CPCh. 2 - Prob. 124CPCh. 2 - Prob. 125CPCh. 2 - Who was Roger Maris? Roger Maris, who spent most...Ch. 2 - Baseballs great home run hitters The Baseballs HR...Ch. 2 - Prob. 128CPCh. 2 - Controlling asthma A study of 13 children...Ch. 2 - Prob. 130CPCh. 2 - Youth unemployment by gender The side-by-side box...Ch. 2 - You give examples Give an example of a variable...Ch. 2 - Political conservatism and liberalism Where do...Ch. 2 - Mode but not median and mean The previous exercise...Ch. 2 - Multiple choice: GRE scores In a study of graduate...Ch. 2 - Multiple choice: Fact about s Which statement...Ch. 2 - Prob. 137CPCh. 2 - True or false: a. The mean, median, and mode can...Ch. 2 - Bad statistic A teacher summarizes grades on an...Ch. 2 - True or false: Soccer According to a story in the...Ch. 2 - Mean for grouped data Refer to the calculation of...Ch. 2 - Prob. 142CPCh. 2 - Range and standard deviation approximation Use the...Ch. 2 - Range the least resistant Weve seen that measures...Ch. 2 - Using MAD to measure variability The standard...Ch. 2 - Prob. 146CPCh. 2 - Create own data For the Mean Versus Median web...
Knowledge Booster


Learn more about
Need a deep-dive on the concept behind this application? Look no further. Learn more about this topic, statistics and related others by exploring similar questions and additional content below.Similar questions
- Problem 3 In their lab, engineer Daniel and Paulina are desperately trying to perfect time travel. But the problem is that their machine still struggles with power inconsistencies-sometimes generating too little energy, other times too much, causing unstable time jumps. To prevent catastrophic misjumps into the Jurassic era or the far future, they must calibrate the machine's power output. After extensive testing, they found that the time machine's power output follows a normal distribution, with an average energy level of 8.7 gigawatts and a standard deviation of 1.2 gigawatts. The Time Travel Safety Board has set strict guidelines: For a successful time jump, the machine's power must be between 8.5 and 9.5 gigawatts. What is the probability that a randomly selected time jump meets this precision requirement? Daniel suggests that adjusting the mean power output could improve time-travel accuracy. Can adjusting the mean reduce the number of dangerous misjumps? If yes, what should the…arrow_forwardProblem 5 ( Marybeth is also interested in the experiment from Problem 2 (associated with the enhancements for Captain America's shield), so she decides to start a detailed literature review on the subject. Among others, she found a paper where they used a 2"(4-1) fractional factorial design in the factors: (A) shield material, (B) throwing mechanism, (C) edge modification, and (D) handle adjustment. The experimental design used in the paper is shown in the table below. a. Run A B с D 1 (1) -1 -1 -1 1 2 a 1 -1 -1 1 3 bd -1 1 -1 1 4 abd 1 1 -1 1 5 cd -1 -1 1 -1 6 acd 1 -1 1 -1 7 bc -1 1 1 -1 abc 1 1 1 -1 paper? s) What was the generator used in the 2"(4-1) fractional factorial design described in the b. Based on the resolution of this design, what do you think about the generator used in the paper? Do you think it was a good choice, or would you have selected a different one? Explain your answer in detail.arrow_forwardSuppose we wish to test the hypothesis that women with a sister’s history of breast cancer are at higher risk of developing breast cancer themselves. Suppose we assume that the prevalence rate of breast cancer is 3% among 60- to 64-year-old U.S. women, whereas it is 5% among women with a sister history. We propose to interview 400 women 40 to 64 years of age with a sister history of the disease. What is the power of such a study assuming that the level of significance is 10%? I only need help writing the null and alternative hypotheses.arrow_forward
- 4.96 The breaking strengths for 1-foot-square samples of a particular synthetic fabric are approximately normally distributed with a mean of 2,250 pounds per square inch (psi) and a standard deviation of 10.2 psi. Find the probability of selecting a 1-foot-square sample of material at random that on testing would have a breaking strength in excess of 2,265 psi.4.97 Refer to Exercise 4.96. Suppose that a new synthetic fabric has been developed that may have a different mean breaking strength. A random sample of 15 1-foot sections is obtained, and each section is tested for breaking strength. If we assume that the population standard deviation for the new fabric is identical to that for the old fabric, describe the sampling distribution forybased on random samples of 15 1-foot sections of new fabricarrow_forwardUne Entreprise œuvrant dans le domaine du multividéo donne l'opportunité à ses programmeurs-analystes d'évaluer la performance des cadres supérieurs. Voici les résultats obtenues (sur une échelle de 10 à 50) où 50 représentent une excellente performance. 10 programmeurs furent sélectionnés au hazard pour évaluer deux cadres. Un rapport Excel est également fourni. Programmeurs Cadre A Cadre B 1 34 36 2 32 34 3 18 19 33 38 19 21 21 23 7 35 34 8 20 20 9 34 34 10 36 34 Test d'égalité des espérances: observations pairéesarrow_forwardA television news channel samples 25 gas stations from its local area and uses the results to estimate the average gas price for the state. What’s wrong with its margin of error?arrow_forward
- You’re fed up with keeping Fido locked inside, so you conduct a mail survey to find out people’s opinions on the new dog barking ordinance in a certain city. Of the 10,000 people who receive surveys, 1,000 respond, and only 80 are in favor of it. You calculate the margin of error to be 1.2 percent. Explain why this reported margin of error is misleading.arrow_forwardYou find out that the dietary scale you use each day is off by a factor of 2 ounces (over — at least that’s what you say!). The margin of error for your scale was plus or minus 0.5 ounces before you found this out. What’s the margin of error now?arrow_forwardSuppose that Sue and Bill each make a confidence interval out of the same data set, but Sue wants a confidence level of 80 percent compared to Bill’s 90 percent. How do their margins of error compare?arrow_forward
- Suppose that you conduct a study twice, and the second time you use four times as many people as you did the first time. How does the change affect your margin of error? (Assume the other components remain constant.)arrow_forwardOut of a sample of 200 babysitters, 70 percent are girls, and 30 percent are guys. What’s the margin of error for the percentage of female babysitters? Assume 95 percent confidence.What’s the margin of error for the percentage of male babysitters? Assume 95 percent confidence.arrow_forwardYou sample 100 fish in Pond A at the fish hatchery and find that they average 5.5 inches with a standard deviation of 1 inch. Your sample of 100 fish from Pond B has the same mean, but the standard deviation is 2 inches. How do the margins of error compare? (Assume the confidence levels are the same.)arrow_forward
arrow_back_ios
SEE MORE QUESTIONS
arrow_forward_ios
Recommended textbooks for you
 Holt Mcdougal Larson Pre-algebra: Student Edition...AlgebraISBN:9780547587776Author:HOLT MCDOUGALPublisher:HOLT MCDOUGAL
 Glencoe Algebra 1, Student Edition, 9780079039897...AlgebraISBN:9780079039897Author:CarterPublisher:McGraw Hill
 Big Ideas Math A Bridge To Success Algebra 1: Stu...AlgebraISBN:9781680331141Author:HOUGHTON MIFFLIN HARCOURTPublisher:Houghton Mifflin Harcourt
 Algebra: Structure And Method, Book 1AlgebraISBN:9780395977224Author:Richard G. Brown, Mary P. Dolciani, Robert H. Sorgenfrey, William L. ColePublisher:McDougal Littell
 Functions and Change: A Modeling Approach to Coll...AlgebraISBN:9781337111348Author:Bruce Crauder, Benny Evans, Alan NoellPublisher:Cengage Learning
Holt Mcdougal Larson Pre-algebra: Student Edition...
Algebra
ISBN:9780547587776
Author:HOLT MCDOUGAL
Publisher:HOLT MCDOUGAL
Glencoe Algebra 1, Student Edition, 9780079039897...
Algebra
ISBN:9780079039897
Author:Carter
Publisher:McGraw Hill
Big Ideas Math A Bridge To Success Algebra 1: Stu...
Algebra
ISBN:9781680331141
Author:HOUGHTON MIFFLIN HARCOURT
Publisher:Houghton Mifflin Harcourt
Algebra: Structure And Method, Book 1
Algebra
ISBN:9780395977224
Author:Richard G. Brown, Mary P. Dolciani, Robert H. Sorgenfrey, William L. Cole
Publisher:McDougal Littell
Functions and Change: A Modeling Approach to Coll...
Algebra
ISBN:9781337111348
Author:Bruce Crauder, Benny Evans, Alan Noell
Publisher:Cengage Learning
Hypothesis Testing using Confidence Interval Approach; Author: BUM2413 Applied Statistics UMP;https://www.youtube.com/watch?v=Hq1l3e9pLyY;License: Standard YouTube License, CC-BY
Hypothesis Testing - Difference of Two Means - Student's -Distribution & Normal Distribution; Author: The Organic Chemistry Tutor;https://www.youtube.com/watch?v=UcZwyzwWU7o;License: Standard Youtube License