
Concept explainers
Videos
The following crosstabulation shows the number of households (100s) in each of the four regions of the United States and the number of households at each income level (U.S. Bureau website, August 2013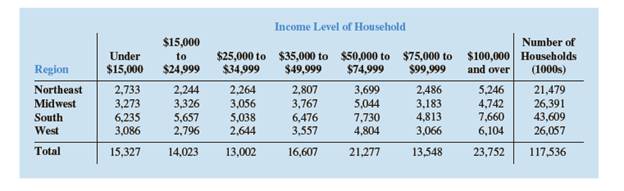
a. Compute the row percentages and identify the percent frequency distributions of income for households in each region.
b. What percentage of households in the West region have an income level of $50,000 or more? What percentage of households in the South region have an income level of $50,000 or more?
c. Construct percent frequency histograms for each region of households. Do any relationships between regions and income level appear to be evident in your findings?
d. Compute the column percentages. What information do the column percentages provide?
e. What percent of households with a household income of $100,000 and over are from the South region? What percentage of households from the South region have a household income of $100,000 and over? Why are these two percentages different?
Want to see the full answer?
Check out a sample textbook solution
Chapter 2 Solutions
Essentials of Modern Business Statistics with Microsoft Office Excel (Book Only)


- solve the question based on hw 1, 1.41arrow_forwardT1.4: Let ẞ(G) be the minimum size of a vertex cover, a(G) be the maximum size of an independent set and m(G) = |E(G)|. (i) Prove that if G is triangle free (no induced K3) then m(G) ≤ a(G)B(G). Hints - The neighborhood of a vertex in a triangle free graph must be independent; all edges have at least one end in a vertex cover. (ii) Show that all graphs of order n ≥ 3 and size m> [n2/4] contain a triangle. Hints - you may need to use either elementary calculus or the arithmetic-geometric mean inequality.arrow_forwardWe consider the one-period model studied in class as an example. Namely, we assumethat the current stock price is S0 = 10. At time T, the stock has either moved up toSt = 12 (with probability p = 0.6) or down towards St = 8 (with probability 1−p = 0.4).We consider a call option on this stock with maturity T and strike price K = 10. Theinterest rate on the money market is zero.As in class, we assume that you, as a customer, are willing to buy the call option on100 shares of stock for $120. The investor, who sold you the option, can adopt one of thefollowing strategies: Strategy 1: (seen in class) Buy 50 shares of stock and borrow $380. Strategy 2: Buy 55 shares of stock and borrow $430. Strategy 3: Buy 60 shares of stock and borrow $480. Strategy 4: Buy 40 shares of stock and borrow $280.(a) For each of strategies 2-4, describe the value of the investor’s portfolio at time 0,and at time T for each possible movement of the stock.(b) For each of strategies 2-4, does the investor have…arrow_forward
- Negate the following compound statement using De Morgans's laws.arrow_forwardNegate the following compound statement using De Morgans's laws.arrow_forwardQuestion 6: Negate the following compound statements, using De Morgan's laws. A) If Alberta was under water entirely then there should be no fossil of mammals.arrow_forward
- Negate the following compound statement using De Morgans's laws.arrow_forwardCharacterize (with proof) all connected graphs that contain no even cycles in terms oftheir blocks.arrow_forwardLet G be a connected graph that does not have P4 or C3 as an induced subgraph (i.e.,G is P4, C3 free). Prove that G is a complete bipartite grapharrow_forward
 Glencoe Algebra 1, Student Edition, 9780079039897...AlgebraISBN:9780079039897Author:CarterPublisher:McGraw Hill
 Holt Mcdougal Larson Pre-algebra: Student Edition...AlgebraISBN:9780547587776Author:HOLT MCDOUGALPublisher:HOLT MCDOUGAL
 Big Ideas Math A Bridge To Success Algebra 1: Stu...AlgebraISBN:9781680331141Author:HOUGHTON MIFFLIN HARCOURTPublisher:Houghton Mifflin Harcourt