
Sub part (a):
The Gini ratio.
Sub part (a):
Explanation of Solution
Figure 1 illustrates the Lorenz curve.
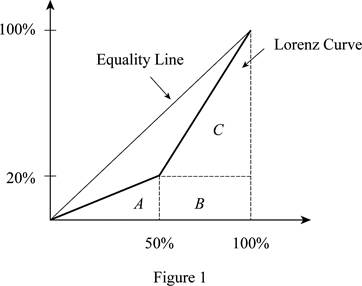
In Figure 1, the horizontal axis measures the percentage of population and the vertical axis measures the percentage of income. In this, we find the area under the Lorenz curve. Thus, the area of triangle can be calculated as follows:
Thus, the area of triangle is 500.
The base of the triangle is 50 (at 50%) because there are only two people in the economy. The height of the triangle is 20 (at 20%) because the lowest income is $20,000, which is 20% of the total income earned in society (= ($20,000 / $100,000) x 100).
The area of the rectangle of B can be calculated as follows:
Thus, the area of the rectangle B value is 1,000.
The area of the rectangle of C can be calculated as follows:
The area of triangle C is 2,000.
The total area under the Lorenz curve can be calculated as follows:
The total area value is 3,500.
The Gini ratio can be calculated as follows:
Thus, the Gini ratio is 0.300.
Concept introduction:
Gini ratio: It is a measure of statistical scattering that is intended to represent the income distribution of a nation's residents and is most commonly used to measure inequality.
Lorenz curve: It is the graphical illustration of the income distribution or of the wealth.
Sub Part (b):
The Gini ratio in the scenario 2.
Sub Part (b):
Explanation of Solution
After the tax and redistribution program Larry's new income is $40,000 and Roger's new income is $60,000. This implies that Larry (50% of the population) now controls 40% of the society's income rather than the 20% before the program.
The area of the triangle A can be calculated as follows:
The value of the triangle area is 1,000.
The value of rectangle B can be calculated as follows:
The area of rectangle B is 2,000.
The area of rectangle C can be calculated as follows:
The area of triangle C can be calculated as follows:
The total area under the Lorenz curve can be calculated as follows:
The total area value is 4,500.
The Gini ratio can be calculated as follows:
Thus the Gini ratio here is 0.100.
Concept introduction:
Gini ratio: It is a measure of statistical scattering that is intended to represent the income distribution of a nation's residents and is most commonly used to measure inequality.
Lorenz curve: It is the graphical illustration of the income distribution or of the wealth.
Sub part (c):
Change in the Gini ratio with change in income.
Sub part (c):
Explanation of Solution
If the income is double, Larry will earn $40,000 and Roger will earn $160,000. The total income in society is now $200,000. Larry still only controls 20% of the society's income ((=$40,000/$200,000) x 100).
Since the doubling of income does not change the percentage of income that is controlled by Larry (or Roger) , the Gini ratio will not change. Thus, the answer will be the same as in part 'a' at 0.300. Thus, the Gini ratio remains the same as it was before and after the income doubles.
Want to see more full solutions like this?
Chapter 23 Solutions
Economics (Irwin Economics)

- Critically analyse the five (5) characteristics of Ubuntu and provide examples of how they apply to the National Health Insurance (NHI) in South Africa.arrow_forwardCritically analyse the five (5) characteristics of Ubuntu and provide examples of how they apply to the National Health Insurance (NHI) in South Africa.arrow_forwardOutline the nine (9) consumer rights as specified in the Consumer Rights Act in South Africa.arrow_forward
- In what ways could you show the attractiveness of Philippines in the form of videos/campaigns to foreign investors? Cite 10 examples.arrow_forwardExplain the following terms and provide an example for each term: • Corruption • Fraud • Briberyarrow_forwardIn what ways could you show the attractiveness of a country in the form of videos/campaigns?arrow_forward
 Principles of Economics (MindTap Course List)EconomicsISBN:9781305585126Author:N. Gregory MankiwPublisher:Cengage Learning
 Principles of Microeconomics (MindTap Course List)EconomicsISBN:9781305971493Author:N. Gregory MankiwPublisher:Cengage Learning
 Principles of Economics, 7th Edition (MindTap Cou...EconomicsISBN:9781285165875Author:N. Gregory MankiwPublisher:Cengage Learning
 Principles of MicroeconomicsEconomicsISBN:9781305156050Author:N. Gregory MankiwPublisher:Cengage Learning
 Microeconomics: Private and Public Choice (MindTa...EconomicsISBN:9781305506893Author:James D. Gwartney, Richard L. Stroup, Russell S. Sobel, David A. MacphersonPublisher:Cengage Learning
 Economics: Private and Public Choice (MindTap Cou...EconomicsISBN:9781305506725Author:James D. Gwartney, Richard L. Stroup, Russell S. Sobel, David A. MacphersonPublisher:Cengage Learning