Illustrate the aggregate
Explanation of Solution
In
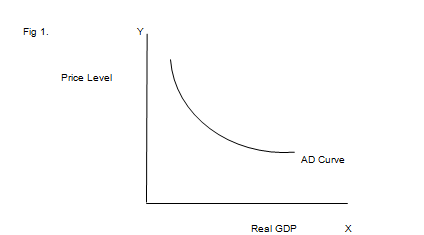
The total/aggregate demand curve depicts the aggregate amount of all products (and services) demanded by the economy at various price levels. A case of a total demand curve is given in Figure 1 as follows:

Shifts of Aggregate Demand Curve
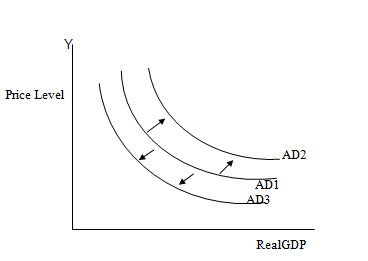
Changes in aggregate demand are indicated by shifts in the aggregate demand curve. A representation of the two ways by which the total demand curve can move is given in Figure 2 as follows:

Changes in aggregate demand are not caused by changes in the price level. Rather, they are caused by changes in the demand for any of the parts of real GDP. Changes in the demand for consumption of products and services, changes in investment spending, changes in the government demand for merchandise and services, or changes in the demand for net exports.
Think about a few cases. Assume shop Keepers were to diminish their spending on all merchandise and services, maybe because of a recession. At that point, the total demand curve would move to the left.
Assume loan fees as interest rates were to fall with the goal that financial specialist expand their investment spending; the total demand curve would move to the right.
If government somehow managed to slice spending to lessen a budget deficit, the total demand curve would move to the left.
In the event that the livelihoods of foreigners were to rise, empowering them to request more domestic-made merchandise, net exports would increment, and total demand would move to the right.
These are only a couple of the numerous conceivable ways the total aggregate demand may move. None of these clarifications, in any case, has anything to do with changes in the price level.
Introduction:
The total/aggregate demand curve depicts the aggregate amount of all products (and services) demanded by the economy at various price levels. Changes in aggregate demand are not caused by changes in the price level. Rather, they are caused by changes in the demand for any of the parts of real GDP. Changes in the demand for consumption of products and services, Changes in investment spending, Changes in the government demand for merchandise and services, or changes in the demand for net exports.
Want to see more full solutions like this?
Chapter 23 Solutions
MYLAB ECONOMICS WITH PEARSON ETEXT -- A

 Principles of Economics (12th Edition)EconomicsISBN:9780134078779Author:Karl E. Case, Ray C. Fair, Sharon E. OsterPublisher:PEARSON
 Engineering Economy (17th Edition)EconomicsISBN:9780134870069Author:William G. Sullivan, Elin M. Wicks, C. Patrick KoellingPublisher:PEARSON
 Principles of Economics (MindTap Course List)EconomicsISBN:9781305585126Author:N. Gregory MankiwPublisher:Cengage Learning
 Managerial Economics: A Problem Solving ApproachEconomicsISBN:9781337106665Author:Luke M. Froeb, Brian T. McCann, Michael R. Ward, Mike ShorPublisher:Cengage Learning
 Managerial Economics & Business Strategy (Mcgraw-...EconomicsISBN:9781259290619Author:Michael Baye, Jeff PrincePublisher:McGraw-Hill Education


