
Illustrate the aggregate
Explanation of Solution
In
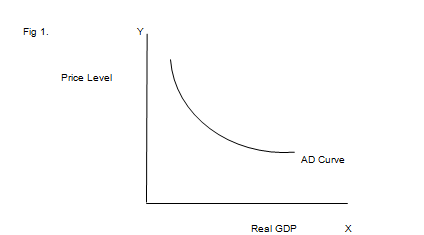
The total/aggregate demand curve depicts the aggregate amount of all products (and services) demanded by the economy at various price levels. A case of a total demand curve is given in Figure 1 as follows:
Shifts of Aggregate Demand Curve
Changes in aggregate demand are indicated by shifts in the aggregate demand curve. A representation of the two ways by which the total demand curve can move is given in Figure 2 as follows:
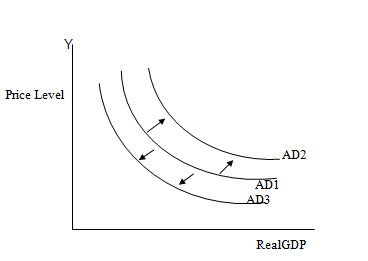
Changes in aggregate demand are not caused by changes in the price level. Rather, they are caused by changes in the demand for any of the parts of real GDP. Changes in the demand for consumption of products and services, changes in investment spending, changes in the government demand for merchandise and services, or changes in the demand for net exports.
Think about a few cases. Assume shop Keepers were to diminish their spending on all merchandise and services, maybe because of a recession. At that point, the total demand curve would move to the left.
Assume loan fees as interest rates were to fall with the goal that financial specialist expand their investment spending; the total demand curve would move to the right.
If government somehow managed to slice spending to lessen a budget deficit, the total demand curve would move to the left.
In the event that the livelihoods of foreigners were to rise, empowering them to request more domestic-made merchandise, net exports would increment, and total demand would move to the right.
These are only a couple of the numerous conceivable ways the total aggregate demand may move. None of these clarifications, in any case, has anything to do with changes in the price level.
Introduction:
The total/aggregate demand curve depicts the aggregate amount of all products (and services) demanded by the economy at various price levels. Changes in aggregate demand are not caused by changes in the price level. Rather, they are caused by changes in the demand for any of the parts of real GDP. Changes in the demand for consumption of products and services, Changes in investment spending, Changes in the government demand for merchandise and services, or changes in the demand for net exports.
Want to see more full solutions like this?
Chapter 23 Solutions
Economics of Money, Banking and Financial Markets, The, Business School Edition (4th Edition) (The Pearson Series in Economics)

- Consider the following supply and demand schedule of wooden tables.a. Draw the corresponding graphs for supply and demand.b. Using the data, obtain the corresponding supply and demand functions. c. Find the market-clearing price and quantity. Price (Thousand s USD Supply Demand 2 96 1104 196 1906 296 2708 396 35010 496 43012 596 51014 696 59016 796 67018 896 75020…arrow_forwardConsider a firm with the following production function Q=5000L-2L2.a. Find the maximum production level.b. How many units of labour are needed at that point. c. Obtain the function of marginal product of labour (MRL) d. Graph the production function and the MRL.arrow_forwardExercise 4A firm has the following total cost function TC=100q-5q2+0.5q3. Find the average cost function.arrow_forward
- A firm has the following demand function P=200 − 2Q and the average costof AC= 100/Q + 3Q −20.a. Find the profit function. b. Estimate the marginal cost function. c. Obtain the production that maximizes the profit. d. Evaluate the average cost and the marginal cost at the maximising production level.arrow_forwardRubber: Initial investment: $159,000 Annual cost: $36,000 Annual revenue: $101,000 Salvage value: $12,000 Useful life: 10 years Using the cotermination assumptions, a study period of 6 years, and a MARR of 9%, what is the present worth of the rubber alternative? Assume that the rubber alternative's equipment has a market value of $18,000 at the end of Year 6.arrow_forwardRichard has just opened a new restaurant. Not being good at deserts, he has contracted with Carla to provide pies. Carla’s costs are $10 per pie, and she sells the pies to Richard for $25 each. Richard resells them for $50, and he incurs no costs other than the $25 he pays Carla. Assume Carla’s costs go up to $30 per pie. If courts always award expectation damages, which of the following statements is most likely to be true?arrow_forward
- Difference-in-Difference In the beginning of 2001, North Dakota legalized fireworks. Suppose you are interested in studying the effect of the legalizing of fireworks on the number of house fires in North Dakota. Unlike North Dakota, South Dakota did not legalize fireworks and continued to ban them. You decide to use a Difference-in-difference (DID) Model. The numbers of house fires in each state at the end of 2000 and 2001 are as follows: Number of house fires in Number of house fires in Year North Dakota 2000 2001 35 50 South Dakota 54 64 a. What is the change in the outcome for the treatment group between 2000 and 2001? Show your working for full credit. (10 points) b. Can we interpret the change in the outcome for the treatment group between 2000 and 2001 as the causal effect of legalizing fireworks on number of house fires? Explain your answer. (10 points)arrow_forwardC. Regression Discontinuity Birth weight is used as a common sign for a newborn's health. In the United States, if a baby has a birthweight below 1500 grams, the newborn is classified as having “very low birth weight". Suppose you want to study the effect of having very low birth weight on the number of hospital visits made before the baby's first birthday. You decide to use Regression Discontinuity to answer this question. The graph below shows the RD model: Number of hospital visits made before baby's first birthday 5 1400 1450 1500 1550 1600 Birthweight (in grams) a. What is the running variable? (5 points) b. What is the cutoff? (5 points) T What is the discontinuity in the graph and how do you interpret it? (10 points)arrow_forwardC. Regression Discontinuity Birth weight is used as a common sign for a newborn's health. In the United States, if a baby has a birthweight below 1500 grams, the newborn is classified as having “very low birth weight". Suppose you want to study the effect of having very low birth weight on the number of hospital visits made before the baby's first birthday. You decide to use Regression Discontinuity to answer this question. The graph below shows the RD model: Number of hospital visits made before baby's first birthday 5 1400 1450 1500 1550 1600 Birthweight (in grams) a. What is the running variable? (5 points) b. What is the cutoff? (5 points) T What is the discontinuity in the graph and how do you interpret it? (10 points)arrow_forward
- Experiments Research suggests that if students use laptops in class, it can have some effect on student achievement. While laptop usage can help students take lecture notes faster, some argue that the laptops may be a source of distraction for the students. Suppose you are interested in looking at the effect of using laptops in class on the students' final exam scores out of 100. You decide to conduct a randomized control trial where you randomly assign some students at UIC to use a laptop in class and other to not use a laptop in class. (Assume that the classes are in person and not online) a. Which people are a part of the treatment group and which people are a part of the control group? (10 points) b. What regression will you run? Define the variables where required. (10 points)arrow_forwardExperiments Research suggests that if students use laptops in class, it can have some effect on student achievement. While laptop usage can help students take lecture notes faster, some argue that the laptops may be a source of distraction for the students. Suppose you are interested in looking at the effect of using laptops in class on the students' final exam scores out of 100. You decide to conduct a randomized control trial where you randomly assign some students at UIC to use a laptop in class and other to not use a laptop in class. (Assume that the classes are in person and not online) a. Which people are a part of the treatment group and which people are a part of the control group? (10 points) b. What regression will you run? Define the variables where required. (10 points)arrow_forwardDummy variables News reports claim that in the last year television watching has increased. You believe that rising unemployment during Covid may be one of the causes for this. Suppose you are interested in looking at the effect of being unemployed on the hours spent watching Netflix per day. You collect data on 10,000 people from Chicago who are between the age of 20 and 60. You define the dummy variable Unemployed which takes the value 1 for those who are unemployed and 0 for those who are employed. Equation 1: Hours spent watching Netflix₁ = ßo + B₁Unemployed; + ε¿ Following is the output for equation 1: reg hours spent_watching_netflix unemployed Source SS df MS Number of obs 10,000 F(1, 9998) = 14314.03 Model Residual 3539.70065 2472.39364 9,998 1 3539.70065 .247288822 Prob F R-squared == 0.0000 = 0.5888 Total 6012.09429 9,999 . 601269556 Adj R-squared Root MSE = 0.5887 .49728 hours spen~x Coef. Std. Err. t P>|t| [95% Conf. Interval] unemployed cons 1.189908 .0099456 119.64…arrow_forward

 Principles of Economics (12th Edition)EconomicsISBN:9780134078779Author:Karl E. Case, Ray C. Fair, Sharon E. OsterPublisher:PEARSON
 Engineering Economy (17th Edition)EconomicsISBN:9780134870069Author:William G. Sullivan, Elin M. Wicks, C. Patrick KoellingPublisher:PEARSON
 Principles of Economics (MindTap Course List)EconomicsISBN:9781305585126Author:N. Gregory MankiwPublisher:Cengage Learning
 Managerial Economics: A Problem Solving ApproachEconomicsISBN:9781337106665Author:Luke M. Froeb, Brian T. McCann, Michael R. Ward, Mike ShorPublisher:Cengage Learning
 Managerial Economics & Business Strategy (Mcgraw-...EconomicsISBN:9781259290619Author:Michael Baye, Jeff PrincePublisher:McGraw-Hill Education