Data from a 20-yr study show the number of new AIDS cases diagnosed among 20- to 24-yr-olds in the United States x years after the study began. a. Approximate the interval(s) over which the number of new AIDS cases among 20- to 24-yr-olds increased. b. Approximate the interval(s) over which the number of new AIDS cases among 20- to 24-yr-olds decreased. c. How many turning points does the graph show? d. Based on the number of turning points, what is the minimum degree of a polynomial function that could be used to model the data? Would the leading coefficient be positive or negative? e. How many years after the study began was the number of new AIDS cases among 20- to 24-yr-olds the greatest? f. What was the maximum number of new cases diagnosed in a single year?
Data from a 20-yr study show the number of new AIDS cases diagnosed among 20- to 24-yr-olds in the United States x years after the study began. a. Approximate the interval(s) over which the number of new AIDS cases among 20- to 24-yr-olds increased. b. Approximate the interval(s) over which the number of new AIDS cases among 20- to 24-yr-olds decreased. c. How many turning points does the graph show? d. Based on the number of turning points, what is the minimum degree of a polynomial function that could be used to model the data? Would the leading coefficient be positive or negative? e. How many years after the study began was the number of new AIDS cases among 20- to 24-yr-olds the greatest? f. What was the maximum number of new cases diagnosed in a single year?
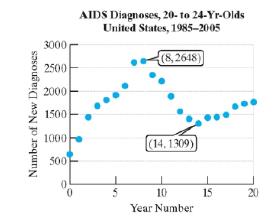
Data from a 20-yr study show the number of new AIDS cases diagnosed among 20- to 24-yr-olds in the United States x years after the study began.
a. Approximate the interval(s) over which the number of new AIDS cases among 20- to 24-yr-olds increased.
b. Approximate the interval(s) over which the number of new AIDS cases among 20- to 24-yr-olds decreased.
c. How many turning points does the graph show?
d. Based on the number of turning points, what is the minimum degree of a polynomial function that could be used to model the data? Would the leading coefficient be positive or negative?
e. How many years after the study began was the number of new AIDS cases among 20- to 24-yr-olds the greatest?
f. What was the maximum number of new cases diagnosed in a single year?
A 20 foot ladder rests on level ground; its head (top) is against a vertical wall. The bottom of the ladder begins by being 12 feet from the wall but begins moving away at the rate of 0.1 feet per second. At what rate is the top of the ladder slipping down the wall? You may use a calculator.
Explain the focus and reasons for establishment of 12.4.1(root test) and 12.4.2(ratio test)
College Algebra with Modeling & Visualization (5th Edition)
Knowledge Booster
Learn more about
Need a deep-dive on the concept behind this application? Look no further. Learn more about this topic, calculus and related others by exploring similar questions and additional content below.
Discrete Distributions: Binomial, Poisson and Hypergeometric | Statistics for Data Science; Author: Dr. Bharatendra Rai;https://www.youtube.com/watch?v=lHhyy4JMigg;License: Standard Youtube License


 Glencoe Algebra 1, Student Edition, 9780079039897...AlgebraISBN:9780079039897Author:CarterPublisher:McGraw Hill
 College Algebra (MindTap Course List)AlgebraISBN:9781305652231Author:R. David Gustafson, Jeff HughesPublisher:Cengage Learning
 Holt Mcdougal Larson Pre-algebra: Student Edition...AlgebraISBN:9780547587776Author:HOLT MCDOUGALPublisher:HOLT MCDOUGAL
 Big Ideas Math A Bridge To Success Algebra 1: Stu...AlgebraISBN:9781680331141Author:HOUGHTON MIFFLIN HARCOURTPublisher:Houghton Mifflin Harcourt