A rocket will carry a communications satellite into low Earth orbit. Suppose that the thrust during the first 200 sec of flight is provided by solid rocket boosters at different points during liftoff. The graph shows the acceleration in G-forces (that is, acceleration in 9 .8-m/sec 2 increments) versus time after launch. a. Approximate the interval(s) over which the acceleration is increasing. b. Approximate the interval(s) over with the acceleration is decreasing. c. How many turning points does the graph show? d. Based on the number of turning points, what is the minimum degree of a polynomial function that could be used to model acceleration versus time? Would the leading coefficient be positive or negative? e. Approximate the time when the acceleration was the greatest. f. Approximate the value of the maximum acceleration.
A rocket will carry a communications satellite into low Earth orbit. Suppose that the thrust during the first 200 sec of flight is provided by solid rocket boosters at different points during liftoff. The graph shows the acceleration in G-forces (that is, acceleration in 9 .8-m/sec 2 increments) versus time after launch. a. Approximate the interval(s) over which the acceleration is increasing. b. Approximate the interval(s) over with the acceleration is decreasing. c. How many turning points does the graph show? d. Based on the number of turning points, what is the minimum degree of a polynomial function that could be used to model acceleration versus time? Would the leading coefficient be positive or negative? e. Approximate the time when the acceleration was the greatest. f. Approximate the value of the maximum acceleration.
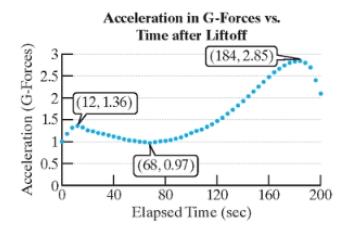
A rocket will carry a communications satellite into low Earth orbit. Suppose that the thrust during the first 200 sec of flight is provided by solid rocket boosters at different points during liftoff. The graph shows the acceleration in G-forces (that is, acceleration in
9
.8-m/sec
2
increments) versus time after launch.
a. Approximate the interval(s) over which the acceleration is increasing.
b. Approximate the interval(s) over with the acceleration is decreasing.
c. How many turning points does the graph show?
d. Based on the number of turning points, what is the minimum degree of a polynomial function that could be used to model acceleration versus time? Would the leading coefficient be positive or negative?
e. Approximate the time when the acceleration was the greatest.
f. Approximate the value of the maximum acceleration.
T
1
7. Fill in the blanks to write the calculus problem that would result in the following integral (do
not evaluate the interval). Draw a graph representing the problem.
So
π/2
2 2πxcosx dx
Find the volume of the solid obtained when the region under the curve
on the interval
is rotated about the
axis.
38,189
5. Draw a detailed graph to and set up, but do not evaluate, an integral for the volume of the
solid obtained by rotating the region bounded by the curve: y = cos²x_for_ |x|
≤
and the curve y
y =
about the line
x =
=플
2
80
F3
a
FEB
9
2
7
0
MacBook Air
3
2
stv
DG
Find f(x) and g(x) such that h(x) = (fog)(x) and g(x) = 3 - 5x.
h(x) = (3 –5x)3 – 7(3 −5x)2 + 3(3 −5x) – 1
-
-
-
f(x) = ☐
Need a deep-dive on the concept behind this application? Look no further. Learn more about this topic, calculus and related others by exploring similar questions and additional content below.
Area Between The Curve Problem No 1 - Applications Of Definite Integration - Diploma Maths II; Author: Ekeeda;https://www.youtube.com/watch?v=q3ZU0GnGaxA;License: Standard YouTube License, CC-BY


 Algebra & Trigonometry with Analytic GeometryAlgebraISBN:9781133382119Author:SwokowskiPublisher:Cengage

 Functions and Change: A Modeling Approach to Coll...AlgebraISBN:9781337111348Author:Bruce Crauder, Benny Evans, Alan NoellPublisher:Cengage Learning
 Linear Algebra: A Modern IntroductionAlgebraISBN:9781285463247Author:David PoolePublisher:Cengage Learning
 Algebra and Trigonometry (MindTap Course List)AlgebraISBN:9781305071742Author:James Stewart, Lothar Redlin, Saleem WatsonPublisher:Cengage Learning