
Concept explainers
Videos
A rocket will carry a communications satellite into low Earth orbit. Suppose that the thrust during the first 200 sec of flight is provided by solid rocket boosters at different points during liftoff. The graph shows the acceleration in G-forces (that is, acceleration in
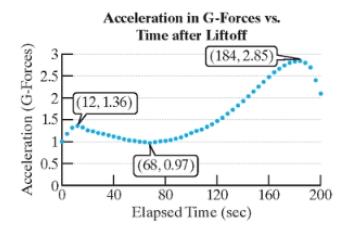
a. Approximate the interval(s) over which the acceleration is increasing.
b. Approximate the interval(s) over with the acceleration is decreasing.
c. How many turning points does the graph show?
d. Based on the number of turning points, what is the minimum degree of a polynomial function that could be used to model acceleration versus time? Would the leading coefficient be positive or negative?
e. Approximate the time when the acceleration was the greatest.
f. Approximate the value of the maximum acceleration.
Want to see the full answer?
Check out a sample textbook solution
Chapter 2 Solutions
PRECALCULUS
Additional Math Textbook Solutions
Basic Business Statistics, Student Value Edition
Calculus: Early Transcendentals (2nd Edition)
University Calculus: Early Transcendentals (4th Edition)
Thinking Mathematically (6th Edition)
Elementary Statistics (13th Edition)
Precalculus


- R₂ = X2 2) slots per pole per phase = 3/3 1 B-180-60 msl Ka Sin (1) Isin () sin(30) Sin (30) اذا ميريد شرح الكتب بس 0 بالفراغ 3) Cos (30) 0.866 4) Rotating 5) Synchronous speed, 120 x 50 s = 1000-950 1000 Copper losses 5kw Rotor input 5 6) 1 0.05 G 50105 loo kw اذا ميريد شرح الكتب فقط look 7) rotov DC ined sove in peaper I need a detailed solution on paper please 064 2- A hot ball (D=15 cm ) is cooled by forced air T.-30°C, the rate of heat transfer from the ball is 460.86 W. Take for the air -0.025 Wim °C and Nu=144.89, find the ball surface temperature a) 300 °C 16 b) 327 °C c) 376 °C d) None か = 750 01arrow_forwardDon't do 14. Please solve 19arrow_forwardPlease solve 14 and 15arrow_forward
- 1. Consider the following system of equations: x13x2 + 4x3 - 5x4 = 7 -2x13x2 + x3 - 6x4 = 7 x16x213x3 - 21x4 = 28 a) Solve the system. Write your solution in parametric and vector form. b) What is a geometric description of the solution. 7 c) Is v = 7 in the span of the set S= [28. 1 HE 3 -5 3 ·6 ? If it is, write v 6 as a linear combination of the vectors in S. Justify. d) How many solutions are there to the associated homogeneous system for the system above? Justify. e) Let A be the coefficient matrix from the system above. Find the set of all solutions to Ax = 0. f) Is there a solution to Ax=b for all b in R³? Justify.arrow_forward4. Suppose that A is made up of 5 column vectors in R³, and suppose that the rank(A)=3. a. How many solutions are there to Ax=0? Justify. b. What is a geometric description for the nullspace(A)? Justify. c. Do the column vectors of A span R³? Justify. d. Is A invertible? Justify.arrow_forward3. Suppose that A is 5 x 5 and rank(A)=4. Use this information to answer the following. a. Give a geometric description of nullspace(A). Justify. b. Is A invertible? Justify. c. Give a geometric description of the span of the column vectors of A. What space are the column vectors of A in? Justify. d. What is determinant of A? Justify.arrow_forward
- 2. Consider the matrix: A || 1 1 -3 14 2 1 01 4 1 2 2 -26 1 -3 1 5] a) What is rank(A)? b) Is A invertible? Justify. c) Find the nullspace(A). Justify. d) Is the trivial solution the only solution to Ax=0? Justify. e) What is the span of the column vectors of A? Justify.arrow_forwardE 5. Suppose that S={v € R²: v = [2x² - 3]}. Is S a subspace of R²? Prove or disprovearrow_forward6. Suppose that V1, V2 ER", show that span{v1, v2} is a subspace of Rn.arrow_forward
- Ra X 2) slots per pole per phase 3/31 180 Ko Sin (1) Kdl 1 sin (4) sin(3) Sin (30) اذا مرید شرح الكتب بس 0 بالفراغ 3) Cos (30) 0.866 4) Rotating 5) Synchronous speed, 120 Fo lasa! G s.1000-950 20:05 1000 Capper losses: 5kw Rotor input lookw 0.05 ined sove in peaper I need a detailed solution on paper please 6) 1 ۳/۱ وه اذا ميريد شرح الكتب فقط look DC 7) rotov Find the general solution of the following equations: +4y=tan2x 3 7357 Find the general solution of the following equations: - Qll y + y (³) = 0. 101arrow_forwardB: 18060 msl Kd Ka, Sin (n) I sin () sin(30) Sin (30) اذا ميريد شرح الكتب بس 0 بالفراغ 3) Cos (30) 0.866 4) Rotating 5) Synchronous speed, 120 x 50 G 5005 1000 s = 1000-950 Copper bosses 5kW /0001 Rotor input 5 : loo kw 0.05 6) 1 اذا ميريد شرح الكتب فقط ١٥٠ 7) rotov DC ined sove in Deaper I need a detailed solution on paper please dy x+2y-4 = dx 2x-y-3 Find the general solution of the following equations: 02//yl-4y+13y=esinarrow_forward1) R₂ = X2 2) slots per pole per phase = 3/31 B msl kd 180 60 Kal Sin (1) I sin () sin(30) Sin (30) اذا ميريد شرح الكتب بس 0 بالفراغ 3) Cos (30) 0.866 4) Rotating 5) Synchronous speed, 120 x 50 G 5005 1000 s = 1000-950 Copper bosses 5kW Rotor input: 5 0.05 loo kw 6) 1 /0001 اذا ميريد شرح الكتب فقط look 7) rotov DC ined sove in peaper I need a detailed solution on paper please Q1// Find the solution of: 'y' = x² +376 x4+316 xyo Q2 Find the solution of the initial-valued problems: ex-y y' +exarrow_forward
 Algebra & Trigonometry with Analytic GeometryAlgebraISBN:9781133382119Author:SwokowskiPublisher:Cengage

 Functions and Change: A Modeling Approach to Coll...AlgebraISBN:9781337111348Author:Bruce Crauder, Benny Evans, Alan NoellPublisher:Cengage Learning
 Linear Algebra: A Modern IntroductionAlgebraISBN:9781285463247Author:David PoolePublisher:Cengage Learning
 Algebra and Trigonometry (MindTap Course List)AlgebraISBN:9781305071742Author:James Stewart, Lothar Redlin, Saleem WatsonPublisher:Cengage Learning