
Videos
MCAT-Style Passage Problems
Lightbulb Failure
You’ve probably observed that the most common time for an incandescent lightbulb to fail is the moment when it is turned on. Let’s look at the properties of the bulb’s filament to see why this happens.
The current in the tungsten filament of a lightbulb heats the filament until it glows. The filament is so hot that some of the atoms on its surface fly off and end up sticking on a cooler part of the bulb. Thus the filament gets progressively thinner as the bulb ages. There will certainly be one spot on the filament that is a bit thinner than elsewhere. This thin segment will have a higher resistance than the surrounding filament. More power will be dissipated at this spot, so it won’t only be a thin spot, it also will be a hot spot.
Now, let’s look at the resistance of the filament. The graph in Figure P22.70 shows data for the current in a lightbulb as a function of the potential difference across it. The graph is not linear, so the filament is not an ohmic material with a constant resistance. However, we can define the resistance at any particular potential difference ∆V to be R = ∆V/I. This ratio, and hence the resistance, increases with ∆V and thus with temperature.
Figure P22. 70
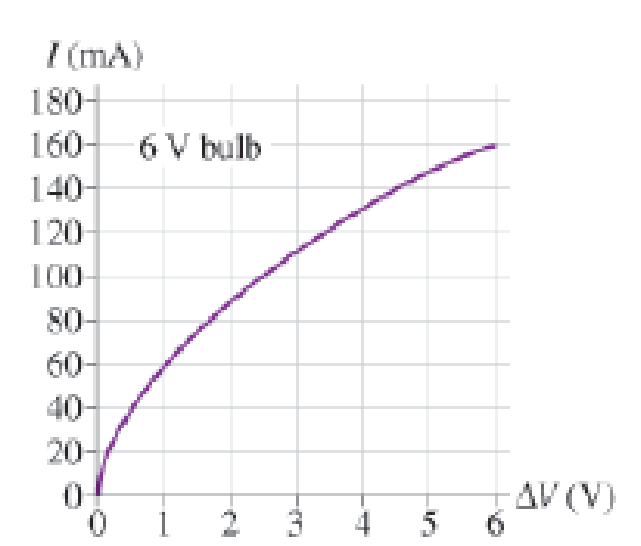
When the bulb is turned on, the filament is cold and its resistance is much lower than during normal, high-temperature operation. The low resistance causes a surge of higher-than-normal current lasting a fraction of a second until the filament heats up. Because power dissipation is I2R, the power dissipated during this first fraction of a second is much larger than the bulb’s rated power. This current surge concentrates the power dissipation at the high-resistance thin spot, perhaps melting it and breaking the filament.
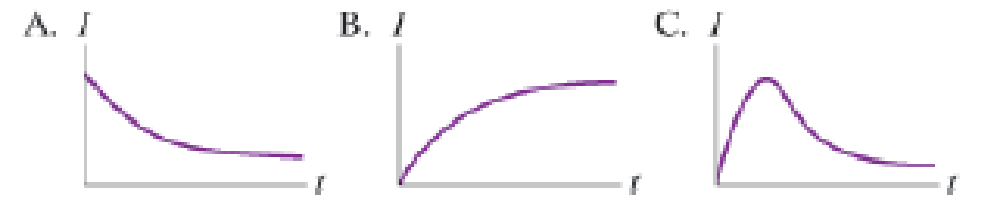
Which of the curves in Figure P22.72 best represents the expected variation in current as a function of time in the short time interval immediately after the bulb is turned on?
Figure P22.72
Want to see the full answer?
Check out a sample textbook solution
Chapter 22 Solutions
College Physics: A Strategic Approach (3rd Edition)
Additional Science Textbook Solutions
Human Physiology: An Integrated Approach (8th Edition)
Microbiology: An Introduction
Human Anatomy & Physiology (2nd Edition)
Campbell Essential Biology with Physiology (5th Edition)
Introductory Chemistry (6th Edition)
Microbiology: An Introduction


- 4. In the figure below what is the value of the angle 0? A 30arrow_forwardPLEASE help with the experimental setup for this theory because i am so confused.arrow_forwardPart 2 - Geometry and Trigonometry 1. Line B touches the circle at a single point. Line A extends radially through the center of the circle. A B (a) Which line is tangential to the circumference of the circle? (b) What is the angle between lines A and B. 2. In the figure below what is the angle C? 30 45 3. In the figure below what is the value of the angle 0? 30° 4. In the figure below what is the value of the angle 0? A 30°arrow_forward
- Details solution No chatgpt plsarrow_forwardPlease solve and answer the problem correctly please.Thank you!!arrow_forwardWill you please walk me through the calculations in more detail for solving this problem? I am a bit rusty on calculus and confused about the specific steps of the derivation: https://www.bartleby.com/solution-answer/chapter-3-problem-15e-modern-physics-2nd-edition/9780805303087/7cf8c31d-9476-46d5-a5a9-b897b16fe6fcarrow_forward
- please help with the abstract. Abstract - This document outlines the format of the lab report and describes the Excel assignment. The abstract should be a short paragraph that very briefly includes the experiment objective, method, result and conclusion. After skimming the abstract, the reader should be able to decide whether they want to keep reading your work. Both the format of the report and the error analysis are to be followed. Note that abstract is not just the introduction and conclusion combined, but rather the whole experiment in short including the results. I have attacted the theory.arrow_forwardUsing the Experimental Acceleration due to Gravity values from each data table, Data Tables 1, 2, and 3; determine the Standard Deviation, σ, mean, μ, variance, σ2 and the 95% Margin of Error (Confidence Level) Data: Ex. Acc. 1: 12.29 m/s^2. Ex. Acc. 2: 10.86 m/s^2, Ex. Acc. 3: 9.05 m/s^2arrow_forwardIn the Super Smash Bros. games the character Yoshi’s has a “ground pound” down special move where he launches himself downward to attack an enemy beneath him. A) If Yoshi flings himself downwards at 9.76 miles per hour to hit an enemy 10.5 m below him, how fast is Yoshi traveling when he hits the enemy? 1 mile = 1609 m B) How much time does it take Yoshi to hit the enemy beneath him?arrow_forward
 Physics for Scientists and Engineers, Technology ...PhysicsISBN:9781305116399Author:Raymond A. Serway, John W. JewettPublisher:Cengage Learning
 Principles of Physics: A Calculus-Based TextPhysicsISBN:9781133104261Author:Raymond A. Serway, John W. JewettPublisher:Cengage Learning
 Physics for Scientists and Engineers: Foundations...PhysicsISBN:9781133939146Author:Katz, Debora M.Publisher:Cengage Learning
 College PhysicsPhysicsISBN:9781938168000Author:Paul Peter Urone, Roger HinrichsPublisher:OpenStax College
 Physics for Scientists and EngineersPhysicsISBN:9781337553278Author:Raymond A. Serway, John W. JewettPublisher:Cengage Learning