Concept explainers
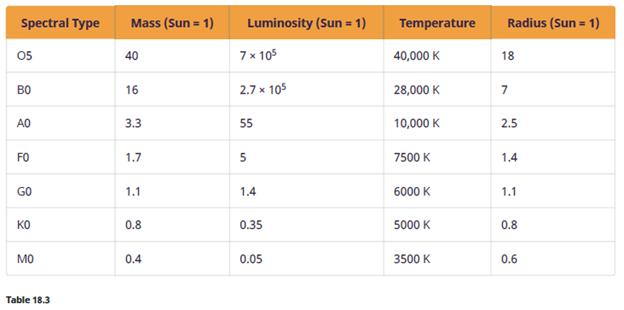
You can use the equation in Exercise 22.34 to estimate the approximate ages of the clusters in Figure 22.10, Figure 22.12, and Figure 22.13. Use the information in the figures to determine the luminosity of the most massive star still on the main sequence. Now use the data in Table 18.3 to estimate the mass of this star. Then calculate the age of the cluster. This method is similar to the procedure used by astronomers to obtain the ages of clusters, except that they use actual data and model calculations rather than simply making estimates from a drawing. How do your ages compare with the ages in the text?
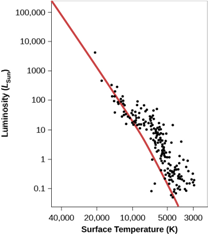
Figure 22.10 NGC 2264 H−R Diagram. Compare this H−R diagram to that in Figure 22.8; although the points scatter a bit more here, the theoretical and observational diagrams are remarkably, and satisfyingly, similar.
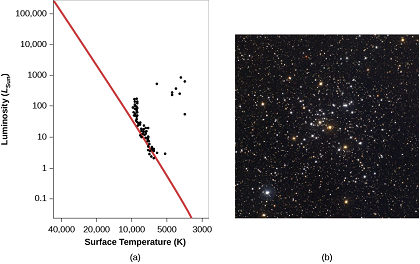
Figure 22.12 Cluster M41. (a) Cluster M41 is older than NGC 2264 (see Figure 22.10) and contains several red giants. Some of its more massive stars are no longer close to the zero-age main sequence (red line). (b) This ground-based photograph shows the open cluster M41. Note that it contains several orange-color stars. These are stars that have exhausted hydrogen in their centers, and have swelled up to become red giants. (credit b: modification of work by NOAO/AURA/NSF)
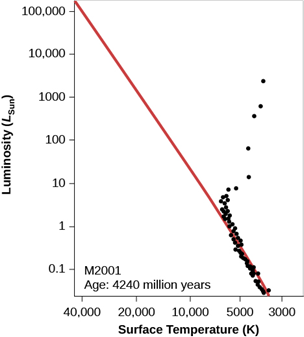
Figure 22.13 H−R Diagram for an Older Cluster. We see the H−R diagram for a hypothetical older cluster at an age of 4.24 billion years. Note that most of the stars on the upper part of the main sequence have turned off toward the red-giant region. And the most massive stars in the cluster have already died and are no longer on the diagram.
Characteristics of Main-Sequence Stars
Want to see the full answer?
Check out a sample textbook solution
Chapter 22 Solutions
Astronomy
Additional Science Textbook Solutions
Biology: Life on Earth (11th Edition)
Cosmic Perspective Fundamentals
Campbell Biology (11th Edition)
Introductory Chemistry (6th Edition)
Human Physiology: An Integrated Approach (8th Edition)
Anatomy & Physiology (6th Edition)


- Two complex values are z1=8 + 8i, z2=15 + 7 i. z1∗ and z2∗ are the complex conjugate values. Any complex value can be expessed in the form of a+bi=reiθ. Find r and θ for (z1-z∗2)/z1+z2∗. Find r and θ for (z1−z2∗)z1z2∗ Please show all stepsarrow_forwardAn electromagnetic wave is traveling through vacuum in the positive x direction. Its electric field vector is given by E=E0sin(kx−ωt)j^,where j^ is the unit vector in the y direction. If B0 is the amplitude of the magnetic field vector, find the complete expression for the magnetic field vector B→ of the wave. What is the Poynting vector S(x,t), that is, the power per unit area associated with the electromagnetic wave described in the problem introduction? Give your answer in terms of some or all of the variables E0, B0, k, x, ω, t, and μ0. Specify the direction of the Poynting vector using the unit vectors i^, j^, and k^ as appropriate. Please explain all stepsarrow_forwardAnother worker is performing a task with an RWL of only 9 kg and is lifting 18 kg, giving him an LI of 2.0 (high risk). Questions:What is the primary issue according to NIOSH?Name two factors of the RWL that could be improved to reduce risk.If the horizontal distance is reduced from 50 cm to 30 cm, how does the HM change and what effect would it have?arrow_forward
- Two complex values are z1=8 + 8i, z2=15 + 7 i. z1∗ and z2∗ are the complex conjugate values. Any complex value can be expessed in the form of a+bi=reiθ. Find r and θ for z1z2∗. Find r and θ for z1/z2∗? Find r and θ for (z1−z2)∗/z1+z2∗. Find r and θ for (z1−z2)∗/z1z2∗ Please explain all steps, Thank youarrow_forwardAn ac series circuit consists of a voltage source of frequency 60 Hz and voltage amplitude V, a 505-Ω resistor, and a capacitor of capacitance 7.2 μF. What must be the source voltage amplitude V for the average electrical power consumed in the resistor to be 236 W? There is no inductance in the circuit.arrow_forwardAn L−R−C series circuit has R= 280 Ω . At the frequency of the source, the inductor has reactance XLL= 905 Ω and the capacitor has reactance XC= 485 Ω . The amplitude of the voltage across the inductor is 445 V . What is the amplitude of the voltage across the resistor and the capacitor? What is the voltage amplitude of the source? What is the rate at which the source is delivering electrical energy to the circuit?arrow_forward
- A 0.185 H inductor is connected in series with a 98.5 Ω resistor and an ac source. The voltage across the inductor is vL=−(12.5V)sin[(476rad/s)t]vL. Derive an expression for the voltage vR across the resistor. Express your answer in terms of the variables L, R, VL (amplitude of the voltage across the inductor), ω, and t. What is vR at 2.13 ms ? Please explain all stepsarrow_forwardA worker lifts a box under the following conditions:Horizontal distance (H): 30 cmInitial height (V): 60 cmVertical travel (D): 50 cmTorso rotation (A): 30°Frequency: 3 times/minute for 1 hourGrip: Good Question:What is the RWL for this task?What does this value mean in terms of occupational safety?arrow_forwardCan someone helparrow_forward
- Can someone help mearrow_forward3. Four identical small masses are connected in a flat perfect square. Rank the relative rotational inertias (IA, IB, IC) about the three axes of rotation shown. Axes A and B are in the plane of the square, and axis C is perpendicular to the plane, through mass m1. ΙΑ IB m2 m1 m3 Ic m4 (a) IAarrow_forwardConsider the circuit shown in the figure below. (Assume L = 5.20 m and R2 = 440 Ω.) (a) When the switch is in position a, for what value of R1 will the circuit have a time constant of 15.4 µs? (b) What is the current in the inductor at the instant the switch is thrown to position b?arrow_forwardarrow_back_iosSEE MORE QUESTIONSarrow_forward_ios
 AstronomyPhysicsISBN:9781938168284Author:Andrew Fraknoi; David Morrison; Sidney C. WolffPublisher:OpenStax
 Foundations of Astronomy (MindTap Course List)PhysicsISBN:9781337399920Author:Michael A. Seeds, Dana BackmanPublisher:Cengage Learning
 Stars and Galaxies (MindTap Course List)PhysicsISBN:9781337399944Author:Michael A. SeedsPublisher:Cengage Learning
 Stars and GalaxiesPhysicsISBN:9781305120785Author:Michael A. Seeds, Dana BackmanPublisher:Cengage Learning