
Videos
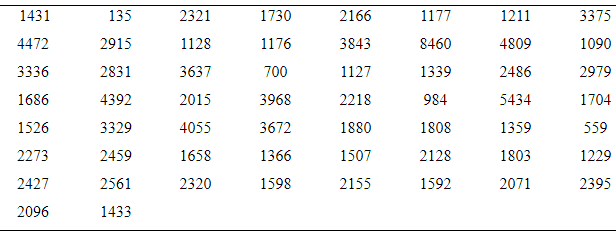
Hail to the chief: There have been 58 presidential inaugurations in U.S. history. At each one, the president has made an inaugural address. Following are the number of words spoken in each of these addresses.
- Construct a frequency distribution with approximately five classes.
- Construct a frequency histogram from the frequency distribution in part (a).
- Construct a relative frequency distribution using the same classes as in part (a).
- Construct a relative frequency histogram from this relative frequency distribution.
- Are the histograms skewed to the left, skewed to the right, or approximately symmetric?
- Construct a frequency distribution with approximately nine classes.
- Repeat parts (b)—(d), using the frequency distribution constructed in part (f).
- Do you think that five and nine classes are both reasonably good choices for these data, or do you think that one choice is much better than the other? Explain your reasoning.
a.
To construct:A frequency distribution with approximately 5 classes.
Explanation of Solution
Given information:There have been 58 presidential inaugurations in U.S. history. At each one, the president has made an inaugural address. Following are the number of words spoken in each of these addresses.
| 1431 | 135 | 2321 | 1730 | 2166 | 1177 | 1211 | 3375 |
| 4472 | 2915 | 1128 | 1176 | 3843 | 8460 | 4809 | 1090 |
| 3336 | 2831 | 3637 | 700 | 1127 | 1339 | 2486 | 2979 |
| 1686 | 4392 | 2015 | 3968 | 2218 | 984 | 5434 | 1704 |
| 1526 | 3329 | 4055 | 3672 | 1880 | 1808 | 1359 | 559 |
| 2273 | 2459 | 1658 | 1366 | 1507 | 2128 | 1803 | 1229 |
| 2427 | 2561 | 2320 | 1598 | 2155 | 1592 | 2071 | 2395 |
| 2096 | 1433 |
Definition used: Frequency distributions for quantitative data are just like those for qualitative data, except the data are divided into classes rather categories.
Solution:
The class width is 2000. The minimum and maximum values of the ratings are 0 and 9999.
The table of frequency distribution is given by
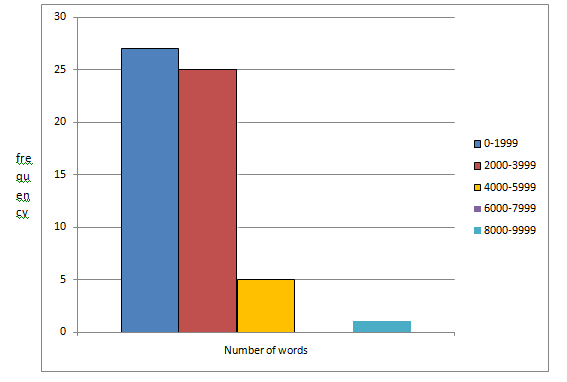
| Number of words | Frequency |
| 0-1999 | 27 |
| 2000-3999 | 25 |
| 4000-5999 | 5 |
| 6000-7999 | 0 |
| 8000-9999 | 1 |
b.
To construct:A frequency histogram from the frequency distribution.
Explanation of Solution
Given information:The table of frequency distribution is given by
| Number of words | Frequency |
| 0-1999 | 27 |
| 2000-3999 | 25 |
| 4000-5999 | 5 |
| 6000-7999 | 0 |
| 8000-9999 | 1 |
Definition used: Histograms based on frequency distributions are called frequency histogram.
Solution:
The frequency histogram for the given data is given by
c.
To construct: A relative frequency distribution.
Explanation of Solution
Given information:The table of frequency distribution is given by
| Number of words | Frequency |
| 0-1999 | 27 |
| 2000-3999 | 25 |
| 4000-5999 | 5 |
| 6000-7999 | 0 |
| 8000-9999 | 1 |
Formula used:
Solution:
From the given table,
The sum of all frequency is
The table of relative frequency is given by
| Number of words | Frequency | Relative frequency |
| 0-1999 | 27 | |
| 2000-3999 | 25 | |
| 4000-5999 | 5 | |
| 6000-7999 | 0 | |
| 8000-9999 | 1 |
d.
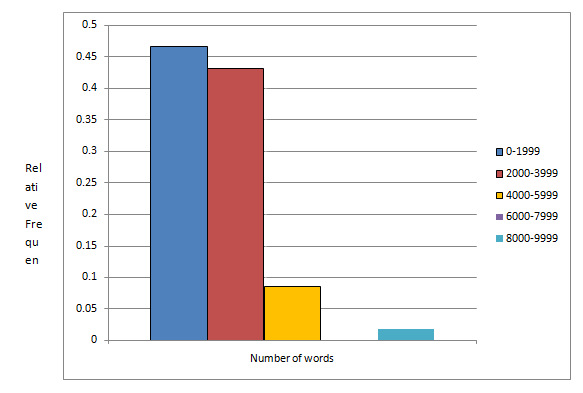
To construct: A relative frequency histogram.
Explanation of Solution
Given information:There have been 58 presidential inaugurations in U.S. history. At each one, the president has made an inaugural address. Following are the number of words spoken in each of these addresses.
| 1431 | 135 | 2321 | 1730 | 2166 | 1177 | 1211 | 3375 |
| 4472 | 2915 | 1128 | 1176 | 3843 | 8460 | 4809 | 1090 |
| 3336 | 2831 | 3637 | 700 | 1127 | 1339 | 2486 | 2979 |
| 1686 | 4392 | 2015 | 3968 | 2218 | 984 | 5434 | 1704 |
| 1526 | 3329 | 4055 | 3672 | 1880 | 1808 | 1359 | 559 |
| 2273 | 2459 | 1658 | 1366 | 1507 | 2128 | 1803 | 1229 |
| 2427 | 2561 | 2320 | 1598 | 2155 | 1592 | 2071 | 2395 |
| 2096 | 1433 |
Definition used: Histograms based on relative frequency distributions are called relative frequency histogram.
Solution:
| Number of words | Relative Frequency |
| 0-1999 | 0.466 |
| 2000-3999 | 0.431 |
| 4000-5999 | 0.086 |
| 6000-7999 | 0.000 |
| 8000-9999 | 0.017 |
Therelative frequency histogram for the given data is given by
e.
To find: Whether the histograms are skewed to the right, skewed to the left, or approximately symmetric.
Answer to Problem 33E
The histogram is skewed to the right.
Explanation of Solution
Given information:There have been 58 presidential inaugurations in U.S. history. At each one, the president has made an inaugural address. Following are the number of words spoken in each of these addresses.
| 1431 | 135 | 2321 | 1730 | 2166 | 1177 | 1211 | 3375 |
| 4472 | 2915 | 1128 | 1176 | 3843 | 8460 | 4809 | 1090 |
| 3336 | 2831 | 3637 | 700 | 1127 | 1339 | 2486 | 2979 |
| 1686 | 4392 | 2015 | 3968 | 2218 | 984 | 5434 | 1704 |
| 1526 | 3329 | 4055 | 3672 | 1880 | 1808 | 1359 | 559 |
| 2273 | 2459 | 1658 | 1366 | 1507 | 2128 | 1803 | 1229 |
| 2427 | 2561 | 2320 | 1598 | 2155 | 1592 | 2071 | 2395 |
| 2096 | 1433 |
Definition used:
A histogram which has a long right-hand tail is said to be skewed to the right.
A histogram which has a long left-hand tail is said to be skewed to the left.
A histogram is symmetric if its right half is a minor image of its left half.
Solution:
The frequency histogram for the given data is given by
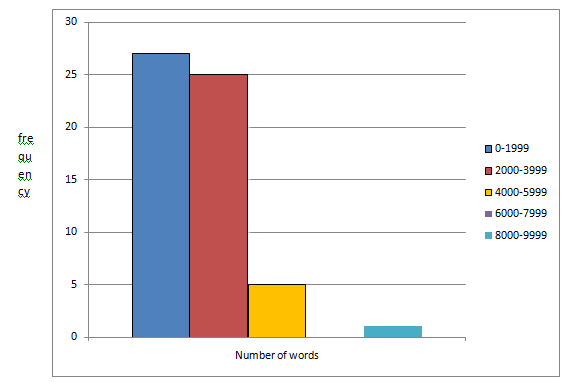
The above histogram has a right-hand tail; therefore, it is skewed to the right.
Hence, the histogram is skewed to the right.
f.
To construct: A frequency distribution with approximately 9 classes.
Explanation of Solution
Given information: There have been 58 presidential inaugurations in U.S. history. At each one, the president has made an inaugural address. Following are the number of words spoken in each of these addresses.
| 1431 | 135 | 2321 | 1730 | 2166 | 1177 | 1211 | 3375 |
| 4472 | 2915 | 1128 | 1176 | 3843 | 8460 | 4809 | 1090 |
| 3336 | 2831 | 3637 | 700 | 1127 | 1339 | 2486 | 2979 |
| 1686 | 4392 | 2015 | 3968 | 2218 | 984 | 5434 | 1704 |
| 1526 | 3329 | 4055 | 3672 | 1880 | 1808 | 1359 | 559 |
| 2273 | 2459 | 1658 | 1366 | 1507 | 2128 | 1803 | 1229 |
| 2427 | 2561 | 2320 | 1598 | 2155 | 1592 | 2071 | 2395 |
| 2096 | 1433 |
Definition used: Frequency distributions for quantitative data are just like those for qualitative data, except the data are divided into classes rather categories.
Solution:
Let us take the class width is 1000. The minimum and maximum values of the ratings are 0 and 8999.
The table of frequency distribution is given by
| Number of words | Frequency |
| 0-999 | 4 |
| 1000-1999 | 23 |
| 2000-2999 | 18 |
| 3000-3999 | 7 |
| 4000-4999 | 4 |
| 5000-5999 | 1 |
| 6000-6999 | 0 |
| 7000-7999 | 0 |
| 8000-8999 | 1 |
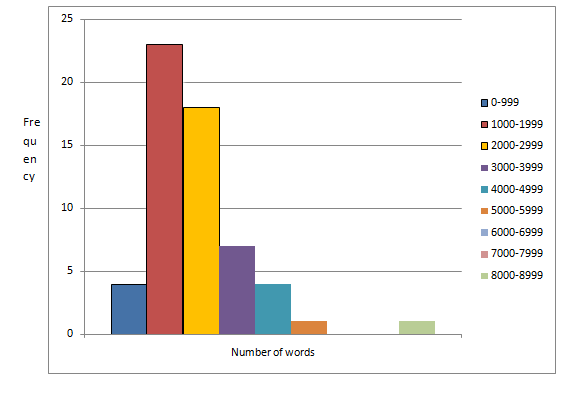
g.
To construct: A frequency histogram, relative frequency distribution and relative frequency histogram.
Explanation of Solution
Given information: The table of frequency distribution is given by
| Number of words | Frequency |
| 0-999 | 4 |
| 1000-1999 | 23 |
| 2000-2999 | 18 |
| 3000-3999 | 7 |
| 4000-4999 | 4 |
| 5000-5999 | 1 |
| 6000-6999 | 0 |
| 7000-7999 | 0 |
| 8000-8999 | 1 |
Solution:
The frequency histogram for the given data is given by
The sum of all frequency is 58
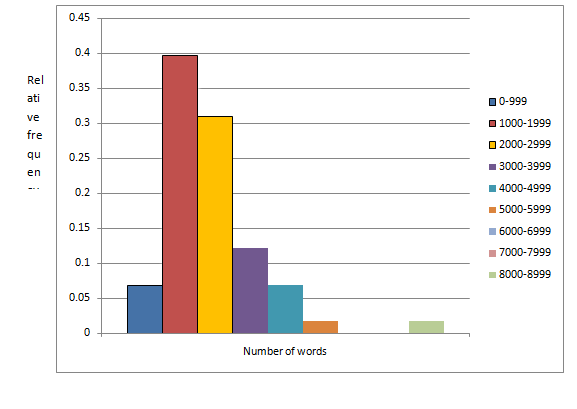
The relative frequency distribution table is given by
| Number of words | Frequency | Relative frequency |
| 0-999 | 4 | |
| 1000-1999 | 23 | |
| 2000-2999 | 18 | |
| 3000-3999 | 7 | |
| 4000-4999 | 4 | |
| 5000-5999 | 1 | |
| 6000-6999 | 0 | |
| 7000-7999 | 0 | |
| 8000-8999 | 1 |
The relative frequency histogram for the given data is given by
g.
To explain: Whether the good choices for the data are that classes with 5 or 9.
Answer to Problem 33E
The one with 9 classes is the good choice than 5 classes
Explanation of Solution
Given information:There have been 58 presidential inaugurations in U.S. history. At each one, the president has made an inaugural address. Following are the number of words spoken in each of these addresses.
| 1431 | 135 | 2321 | 1730 | 2166 | 1177 | 1211 | 3375 |
| 4472 | 2915 | 1128 | 1176 | 3843 | 8460 | 4809 | 1090 |
| 3336 | 2831 | 3637 | 700 | 1127 | 1339 | 2486 | 2979 |
| 1686 | 4392 | 2015 | 3968 | 2218 | 984 | 5434 | 1704 |
| 1526 | 3329 | 4055 | 3672 | 1880 | 1808 | 1359 | 559 |
| 2273 | 2459 | 1658 | 1366 | 1507 | 2128 | 1803 | 1229 |
| 2427 | 2561 | 2320 | 1598 | 2155 | 1592 | 2071 | 2395 |
| 2096 | 1433 |
The one with 9 classes is more appropriate than the one with only 5 classes.
This is because the one with only 5 classes is too wide and only the most basic features of the data are visible.
Hence, the one with 9 classes is the good choice than 5 classes.
Want to see more full solutions like this?
Chapter 2 Solutions
Loose Leaf Version For Elementary Statistics


- Apply STATA commands & submit the output for each question only when indicated below i. Generate the log of birthweight and family income of children. Name these new variables Ibwght & Ifaminc. Include the output of this code. ii. Apply the command sum with the detail option to the variable faminc. Note: you should find the 25th percentile value, the 50th percentile and the 75th percentile value of faminc from the output - you will need it to answer the next question Include the output of this code. iii. iv. Use the output from part ii of this question to Generate a variable called "high_faminc" that takes a value 1 if faminc is less than or equal to the 25th percentile, it takes the value 2 if faminc is greater than 25th percentile but less than or equal to the 50th percentile, it takes the value 3 if faminc is greater than 50th percentile but less than or equal to the 75th percentile, it takes the value 4 if faminc is greater than the 75th percentile. Include the outcome of this code…arrow_forwardsolve this on paperarrow_forwardApply STATA commands & submit the output for each question only when indicated below i. Apply the command egen to create a variable called "wyd" which is the rowtotal function on variables bwght & faminc. ii. Apply the list command for the first 10 observations to show that the code in part i worked. Include the outcome of this code iii. Apply the egen command to create a new variable called "bwghtsum" using the sum function on variable bwght by the variable high_faminc (Note: need to apply the bysort' statement) iv. Apply the "by high_faminc" statement to find the V. descriptive statistics of bwght and bwghtsum Include the output of this code. Why is there a difference between the standard deviations of bwght and bwghtsum from part iv of this question?arrow_forward
- According to a health information website, the distribution of adults’ diastolic blood pressure (in millimeters of mercury, mmHg) can be modeled by a normal distribution with mean 70 mmHg and standard deviation 20 mmHg. b. Above what diastolic pressure would classify someone in the highest 1% of blood pressures? Show all calculations used.arrow_forwardWrite STATA codes which will generate the outcomes in the questions & submit the output for each question only when indicated below i. ii. iii. iv. V. Write a code which will allow STATA to go to your favorite folder to access your files. Load the birthweight1.dta dataset from your favorite folder and save it under a different filename to protect data integrity. Call the new dataset babywt.dta (make sure to use the replace option). Verify that it contains 2,998 observations and 8 variables. Include the output of this code. Are there missing observations for variable(s) for the variables called bwght, faminc, cigs? How would you know? (You may use more than one code to show your answer(s)) Include the output of your code (s). Write the definitions of these variables: bwght, faminc, male, white, motheduc,cigs; which of these variables are categorical? [Hint: use the labels of the variables & the browse command] Who is this dataset about? Who can use this dataset to answer what kind of…arrow_forwardApply STATA commands & submit the output for each question only when indicated below İ. ii. iii. iv. V. Apply the command summarize on variables bwght and faminc. What is the average birthweight of babies and family income of the respondents? Include the output of this code. Apply the tab command on the variable called male. How many of the babies and what share of babies are male? Include the output of this code. Find the summary statistics (i.e. use the sum command) of the variables bwght and faminc if the babies are white. Include the output of this code. Find the summary statistics (i.e. use the sum command) of the variables bwght and faminc if the babies are male but not white. Include the output of this code. Using your answers to previous subparts of this question: What is the difference between the average birthweight of a baby who is male and a baby who is male but not white? What can you say anything about the difference in family income of the babies that are male and male…arrow_forward
- A public health researcher is studying the impacts of nudge marketing techniques on shoppers vegetablesarrow_forwardThe director of admissions at Kinzua University in Nova Scotia estimated the distribution of student admissions for the fall semester on the basis of past experience. Admissions Probability 1,100 0.5 1,400 0.4 1,300 0.1 Click here for the Excel Data File Required: What is the expected number of admissions for the fall semester? Compute the variance and the standard deviation of the number of admissions. Note: Round your standard deviation to 2 decimal places.arrow_forwardA pollster randomly selected four of 10 available people. Required: How many different groups of 4 are possible? What is the probability that a person is a member of a group? Note: Round your answer to 3 decimal places.arrow_forward
- Wind Mountain is an archaeological study area located in southwestern New Mexico. Potsherds are broken pieces of prehistoric Native American clay vessels. One type of painted ceramic vessel is called Mimbres classic black-on-white. At three different sites the number of such sherds was counted in local dwelling excavations. Test given. Site I Site II Site III 63 19 60 43 34 21 23 49 51 48 11 15 16 46 26 20 31 Find .arrow_forwardRothamsted Experimental Station (England) has studied wheat production since 1852. Each year many small plots of equal size but different soil/fertilizer conditions are planted with wheat. At the end of the growing season, the yield (in pounds) of the wheat on the plot is measured. Suppose for a random sample of years, one plot gave the following annual wheat production (in pounds): 4.46 4.21 4.40 4.81 2.81 2.90 4.93 3.54 4.16 4.48 3.26 4.74 4.97 4.02 4.91 2.59 Use a calculator to verify that the sample variance for this plot is . Another random sample of years for a second plot gave the following annual wheat production (in pounds): 3.89 3.81 3.95 4.07 4.01 3.73 4.02 3.78 3.72 3.96 3.62 3.76 4.02 3.73 3.94 4.03 Use a calculator to verify that the sample variance for this plot is . Suppose that we test the claim using that the population variance of annual wheat production for the first plot is larger…arrow_forwardIt is thought that prehistoric Native Americans did not take their best tools, pottery, and household items when they visited higher elevations for their summer camps. It is hypothesized that archaeological sites tend to lose their cultural identity and specific cultural affiliation as the elevation of the site increases. Let x be the elevation (in thousands of feet) for an archaeological site in the southwestern United States. Let y be the percentage of unidentified artifacts (no specific cultural affiliation) at a given elevation. Suppose that the following data were obtained for a collection of archaeological sites in New Mexico: x 5.50 6.00 6.75 7.00 7.75 y 37 38 92 70 99 Find the equation of the least squares line . Round a and b to three decimal places.arrow_forward
 Holt Mcdougal Larson Pre-algebra: Student Edition...AlgebraISBN:9780547587776Author:HOLT MCDOUGALPublisher:HOLT MCDOUGAL
 Glencoe Algebra 1, Student Edition, 9780079039897...AlgebraISBN:9780079039897Author:CarterPublisher:McGraw Hill
 Big Ideas Math A Bridge To Success Algebra 1: Stu...AlgebraISBN:9781680331141Author:HOUGHTON MIFFLIN HARCOURTPublisher:Houghton Mifflin Harcourt