
Concept explainers
a.
To create: A scatter plot showing the deficit on horizontal axis and changes in and bond holding on vertical axis.
a.
Explanation of Solution
Table showing calculation of change in public bond holdings, Federal Reserve bond holding and changes in debt held by public and federal reserve is as follows:
| Period | Budget Deficit | debt held by public | debt held by federal reserve | change in debt held by public | change in debt held by federal reserve | changes in debt held by public and federal reserve |
| 1980-01-01 | 73830 | 699384 | 120800.0 | - | - | - |
| 1981-01-01 | 78968 | 790060 | 123575.0 | 90676 | 2775.0 | 93450.5 |
| 1982-01-01 | 127977 | 910039 | 131825.0 | 119979 | 8250.0 | 128228.8 |
| 1983-01-01 | 207802 | 1111561 | 146425.0 | 201522 | 14600.0 | 216122.3 |
| 1984-01-01 | 185367 | 1290387 | 154900.0 | 178826 | 8475.0 | 187301.0 |
| 1985-01-01 | 212308 | 1494839 | 170275.0 | 204453 | 15375.0 | 219827.5 |
| 1986-01-01 | 221227 | 1718347 | 192700.0 | 223508 | 22425.0 | 245932.5 |
| 1987-01-01 | 149730 | 1889399 | 210800.0 | 171052 | 18100.0 | 189152.3 |
| 1988-01-01 | 155178 | 2039260 | 228175.0 | 149861 | 17375.0 | 167235.8 |
| 1989-01-01 | 152639 | 2175360 | 227075.0 | 136100 | -1100.0 | 134999.8 |
| 1990-01-01 | 221036 | 2418033 | 229700.0 | 242674 | 2625.0 | 245298.5 |
| 1991-01-01 | 269238 | 2704994 | 253400.0 | 286961 | 23700.0 | 310661.3 |
| 1992-01-01 | 290321 | 3018001 | 279350.0 | 313007 | 25950.0 | 338956.5 |
| 1993-01-01 | 255051 | 3279209 | 315750.0 | 261208 | 36400.0 | 297607.8 |
| 1994-01-01 | 203186 | 3474962 | 350600.0 | 195753 | 34850.0 | 230603.0 |
| 1995-01-01 | 163952 | 3645419 | 370550.0 | 170457 | 19950.0 | 190407.3 |
| 1996-01-01 | 107431 | 3776614 | 383950.0 | 131195 | 13400.0 | 144594.8 |
| 1997-01-01 | 21884 | 3835440 | 412125.0 | 58827 | 28175.0 | 87001.8 |
| 1998-01-01 | 69270 | 3803038 | 442775.0 | -32403 | 30650.0 | -1752.5 |
| 1999-01-01 | 125610 | 3715711 | 479400.0 | -87327 | 36625.0 | -50701.8 |
| 2000-01-01 | 236241 | 3508911 | 507425.0 | -206800 | 28025.0 | -178775.0 |
| 2001-01-01 | 128236 | 3360257 | 536200.0 | -148654 | 28775.0 | -119879.3 |
| 2002-01-01 | 157758 | 3526798 | 599925.0 | 166541 | 63725.0 | 230266.0 |
| 2003-01-01 | 377585 | 3873789 | 654100.0 | 346992 | 54175.0 | 401166.5 |
| 2004-01-01 | 412727 | 4276280 | 694900.0 | 402491 | 40800.0 | 443290.5 |
| 2005-01-01 | 318346 | 4604003 | 730650.0 | 327723 | 35750.0 | 363473.3 |
| 2006-01-01 | 248181 | 4853668 | 768175.0 | 249665 | 37525.0 | 287189.5 |
| 2007-01-01 | 160701 | 5045710 | 772900.0 | 192043 | 4725.0 | 196767.8 |
| 2008-01-01 | 458553 | 5701491 | 505625.0 | 655781 | -267275.0 | 388505.8 |
| 2009-01-01 | 1412688 | 7345425 | 673650.0 | 1643934 | 168025.0 | 1811958.5 |
| 2010-01-01 | 1294373 | 8839123 | 846725.0 | 1493699 | 173075.0 | 1666773.8 |
| 2011-01-01 | 1299599 | 9996999 | 1572000.0 | 1157875 | 725275.0 | 1883150.3 |
| 2012-01-01 | 1086955 | 11196392 | 1658100.0 | 1199393 | 86100.0 | 1285493.3 |
| 2013-01-01 | 679542 | 12041300 | 2003425.0 | 844908 | 345325.0 | 1190233.0 |
| 2014-01-01 | 484600 | 12755962 | 2720300.0 | 714663 | 716875.0 | 1431537.5 |
| 2015-01-01 | 438496 | 13247211 | 2802050.0 | 491249 | 81750.0 | 572998.5 |
| 2016-01-01 | 584651 | 14121037 | 2827050.0 | 873826 | 25000.0 | 898826.0 |
| 2017-01-01 | 665372 | 14562572 | 2862225.0 | 441535 | 35175.0 | 476710.3 |
Table (1)
Scatter diagram showing public bond holding on the vertical axis and deficit on horizontal axis is as follows:
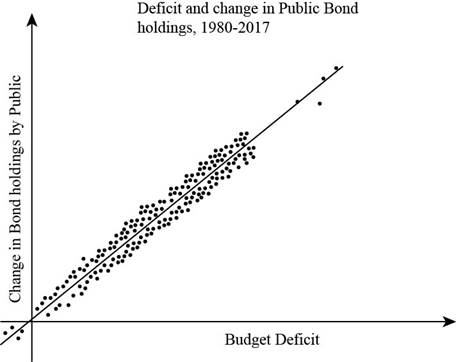
Fig.1
The steep fitted line in Fig. 1 shows the strong relation between the change in debt held by public and deficit from 1980-2017
Introduction:
When the planned expenditure of government exceeds the amount of revenue available to pay for it, it is known as budget deficit.
b.
To create: A scatter plot showing the deficit on horizontal axis and changes in and bond holding by Federal Reserve on vertical axis from 1980-2017.
b.
Explanation of Solution
Diagram showing Federal Reserve bond holdings on the vertical axis and deficit on horizontal axis since 1980 to 2017, is as follows:
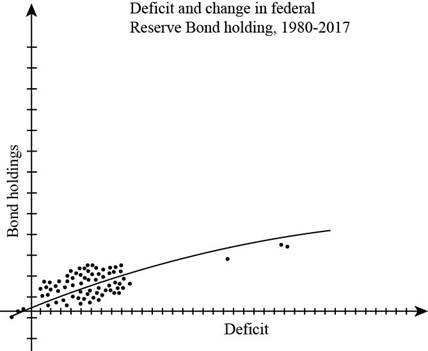
Fig.2
The steeper fitted line shows the positive relationship between bond holdings by the Federal Reserve and deficit but with less prognostic power.
Introduction:
When the planned expenditure of government exceeds the amount of revenue available to pay for it, it is known as budget deficit
c.
To create: A scatter plot showing the deficit on horizontal axis and changes in and bond holding by Federal Reserve on vertical axis from 1980-2007.
c.
Explanation of Solution
Diagram showing Federal Reserve bond holdings on the vertical axis and deficit on horizontal axis since 1980 to 2007, is as follows:
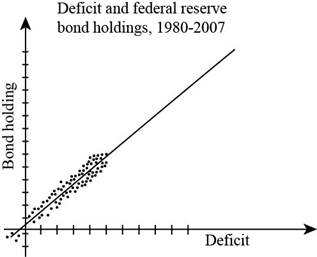
Fig.3
As the fitted line in Fig.1 suggests there was a positive relationship between bond holdings by the Federal Reserve and deficit from1980-2007.
Introduction:
When the planned expenditure of government exceeds the amount of revenue available to pay for it, it is known as budget deficit.
Want to see more full solutions like this?
Chapter 22 Solutions
Economics of Money, Banking and Financial Markets, The, Business School Edition (5th Edition) (What's New in Economics)


- Refer to the given figure. MB and MC represent the social marginal benefit and social marginal cost of pollution abatement. The total net benefit from the optimal level of pollution abatement is $ (Enter your response rounded to the nearest whole number.) D Dollars per Unit 0 MC 18 810 Pollution Abatement -6°C Mostly clear Next MBarrow_forwardSuppose that each firm pollutes 100 units and is given 70 pollution permits (i.e., each firm must reduce pollution by 30 units if they do not trade their permits). If firms are allowed to trade their permits, then the equilibrium price of permits will be and permits. and as a result of being able to trade their OA. $10; firm A buys 20 permits from firm B profits fall by $200 for A and rise by $200 for B OB. $10; firm A buys 20 permits from firm B profits rise by $40 for A and rise by $40 for B OC. $12; firm A sells 10 permits to firm B; profits rise by $40 for A and rise by $40 for B OD. $12, firm A buys 10 permits from firm B profits fall by $120 for A and rise by $120 for B E. None of the above Marginal Abatement Cost ($) 18 16- 4 12- 10- 8- MCA 0 10 20 30 40 50 60 70 80 Pollution Abatement 90 -6°C Mostly clear Next M 40arrow_forwardConsider an economy in which there are two polluters: A and B. The marginal cost of pollution abatement curves are given in the diagram to the right. The total cost of reducing pollution by 60 units if it is done efficiently or $ equals $ if it is done by forcing each firm to reduce pollution by 30 units. OA. 925; 1125 OB. 900; 1100 OC. 850, 1050 OD. 800, 1000 OE. None of the above The efficient levels of pollution reduction can be achieved by using a pollution tax equal to $ unit A. 25 0 per MC 45 40 35 30- 25 20- 15 10- 5- Marginal Abatement Cost ($) 10 20 30 40 50 60 70 80 Pollution Abatement -6°C Mostly clear Next 90arrow_forward
- is initially abating Q units of pollution. Suppose that a system of tradeable pollution permits is introduced into this market and the equilibrium permit price is P* Firm B will sell permits to Firm A because OA. Firm A has lower costs of pollution abatement than Firm B. OB. Firm B's total cost of abating more pollution (area 1) is less than the revenue it earns from selling the permits (areas 5+3). OC. Firm B's total cost of abating more pollution (areas 3+1) is less than the revenue it earns from selling the permits (areas 5+3+1). OD. Firm B can buy the permits at a lower price than Firm A OE. the revenue Firm B earns from selling permits (areas 3+1) is greater than the cost it incurs from abating more pollution (area 1). Dollars per unit Q₁ Qo Q2 Pollution Abatement ил Next -6°C Mostly clear MCA MCBarrow_forwardThe accompanying diagrams show the marginal costs of pollution abatement for two firms, Firm 1 and Firm 2. If the government requires each firm to abate Q units of pollution, the social costs of this abatement OA. could be reduced further if Firm 2 increased abatement and Firm 1 reduced its abatement by the same amount OB. could be reduced further if each firm was required to abate more. OC. could be reduced further if each firm was allowed to pollute more. OD. would be minimized. WOE could be reduced further if Firm 1 increased abatement and Firm 2 reduced its abatement by the same amount. Dollars 5 Firm 1 MC1 Q1 Q2 Q3 Q4 Q5 Q6 Q7 Abatement Q Firm 2 6- MC2 E 屈 Dollars -6°C Mostly clear Nextarrow_forwardThe diagram to the right illustrates a competitive industry in which there is a negative production externality. If a tax equal to $20/unit (i.e., a tax equal to the marginal external cost) is imposed, then the net social benefit will OA. fall by area A+ C. OB. rise by area B+C. OC. fall by area C. OD. rise by area B. OE. None of the above. W Marginal Benefit, Marginal Cost ($) 50 MCS MCp 45 35 30- 25 20 15 10- 5 0- 0 B D 10 20 30 40 50 60 70 80 90 100 110 Quantity -6°C Mostly clear Nextarrow_forward
- Not use ai pleasearrow_forwardProblem 3 Simple Bivariate Regression Consider the following bivariate regression model: NAMEUIN Page 1 of 2 = Hourly Wages, Bo+B₁Education; + & where Education measures the years of experience at the job for an individual and Hourly Wage is the hourly wage in dollars. The subscript i indexes various people. You run a bivariate OLS regression to estimate Bo and B₁. Suppose you estimate B = 10 and B a. 0 = 2 How do you interpret the estimates ßo and ß₁ in this context? (3 points) 1 b. Define the terms "predicted/fitted value" and "residual”. (3 points) c. Suppose that for some individual, the predicted value of Hourly Wage is $20, and the residual is 2. What is the actual Hourly wage for the individual? Show your work. (4 points) d. Suppose that some individual has 10 years of Education, and his actual hourly wage is $35. What is the predicted outcome and residual for this individual? Show your work. (5 points)arrow_forwardProblem 1 The Core Model Suppose you are interested in studying the effect of workers' training (measured by the number of training hours) on employee productivity (measured by output per hour). a. What is the dependent and independent variable in this setting? (2 points) b. How would you write this relationship using the Core Model? (3 points) C. Do you expect the slope coefficient ẞ₁, (which shows relation between teacher's experience and test scores) to be positive or negative? Explain your reasoning. (5 points) d. Name any two factors that are likely included in the error term of your model? (5 points)arrow_forward
- Problem 2 Endogeneity Suppose you are interested in how social media usage affects students' academic performance. Consider the following model: GPA; = ßo + ß₁Social Media Hours; + ɛ; where GPA, is the grade point average of a student and Social Media Hours; measures how many hours the student spends on social media every week. Each student is denoted by the subscript i. a. What is the dependent variable Y in this setting? What is the independent variable X in this setting? (4 points) b. What does Bo C. What does ẞ1 = 3 mean? (2 points) = 0.2 mean? (3 points) d. What is the condition for the independent variable Social Media Hours; to be endogenous? (5 points) e. Is the independent variable likely to be endogenous? Why or why not? (3 points) f. If yes, describe a scenario where the independent variable is endogenous. (3 points)arrow_forwardNot use ai pleasearrow_forwardNot use ai pleasearrow_forward

 Principles of Economics (12th Edition)EconomicsISBN:9780134078779Author:Karl E. Case, Ray C. Fair, Sharon E. OsterPublisher:PEARSON
 Engineering Economy (17th Edition)EconomicsISBN:9780134870069Author:William G. Sullivan, Elin M. Wicks, C. Patrick KoellingPublisher:PEARSON
 Principles of Economics (MindTap Course List)EconomicsISBN:9781305585126Author:N. Gregory MankiwPublisher:Cengage Learning
 Managerial Economics: A Problem Solving ApproachEconomicsISBN:9781337106665Author:Luke M. Froeb, Brian T. McCann, Michael R. Ward, Mike ShorPublisher:Cengage Learning
 Managerial Economics & Business Strategy (Mcgraw-...EconomicsISBN:9781259290619Author:Michael Baye, Jeff PrincePublisher:McGraw-Hill Education