
Fundamentals of Statistics Plus MyLab Statistics with Pearson eText - Title-Specific Access Card Package (5th Edition)
5th Edition
ISBN: 9780134763729
Author: Michael Sullivan III
Publisher: PEARSON
expand_more
expand_more
format_list_bulleted
Videos
Textbook Question
Chapter 2.2, Problem 28AYU
Waiting The data below represent the number of customers waiting for a table at 6:00 P.M. for 40 consecutive Saturdays at Bobak’s Restaurant.
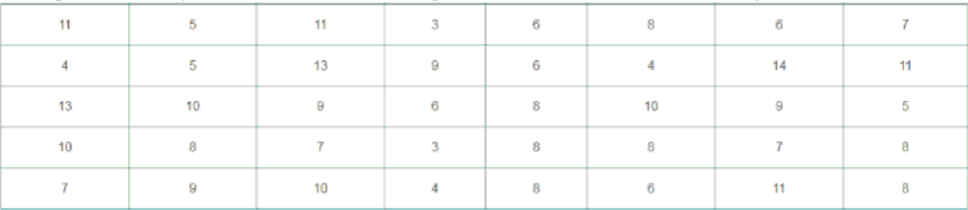
- a. Are these data discrete or continuous? Explain.
- b. Construct a frequency distribution of the data.
- c. Construct a relative frequency distribution of the data.
- d. What percentage of the Saturdays had 10 or more customers waiting for a table at 6:00 P.M
- e. What percentage of the Saturdays had five or fewer customers waiting for a table at 6:00 P.M
- f. Construct a frequency histogram of the data.
- g. Construct a relative frequency histogram of the data.
- h. Describe the shape of the distribution.
Expert Solution & Answer

Trending nowThis is a popular solution!

Students have asked these similar questions
show all steps
Most people know that the probability of getting a head when you flip a fair coin is . You want to use the relative frequency of the event to show that the probability is . How many times should you simulate flipping the coin in the experiment? Would it be better to use 300 trials or 3000 trials? Explain.
The qualified applicant pool for eight management trainee positions consists of ten women and six men. How many different groups of applicants can be selected for the positions
Chapter 2 Solutions
Fundamentals of Statistics Plus MyLab Statistics with Pearson eText - Title-Specific Access Card Package (5th Edition)
Ch. 2.1 - Define raw data in your own words.Ch. 2.1 - A frequency distribution lists the _____ of...Ch. 2.1 - In a relative frequency distribution, what should...Ch. 2.1 - What is a bar graph? What is a Pareto chart?Ch. 2.1 - Flu Season The pie chart shown, the type we see in...Ch. 2.1 - Cosmetic Surgery This USA Today type chart shows...Ch. 2.1 - Most Valuable Player The following Pareto chart...Ch. 2.1 - Poverty The U.S. Census Bureau uses money income...Ch. 2.1 - Divorce The following graph represents the results...Ch. 2.1 - Identity Theft Identity fraud occurs when someone...
Ch. 2.1 - Made in America A random sample of 2163 adults...Ch. 2.1 - Desirability Attributes A random sample of 2163...Ch. 2.1 - College Survey In a national survey conducted by...Ch. 2.1 - College Survey In a national survey conducted by...Ch. 2.1 - Use the Internet? The Gallup organization...Ch. 2.1 - Dining Out A sample of 521 adults was asked, How...Ch. 2.1 - NW Texting A survey of U.S. adults and teens (ages...Ch. 2.1 - Educational Attainment The educational attainment...Ch. 2.1 - Dream Job A survey of adult men and women asked,...Ch. 2.1 - Car Color A survey of 100 randomly selected autos...Ch. 2.1 - Prob. 21AYUCh. 2.1 - Bachelor Party In a survey conducted by Opinion...Ch. 2.1 - Favorite Day to Eat Out A survey was conducted by...Ch. 2.1 - Prob. 25AYUCh. 2.1 - Prob. 26AYUCh. 2.1 - Prob. 27AYUCh. 2.1 - StatCrunch Survey Choose a qualitative variable...Ch. 2.1 - Putting It Together: Online Homework Keeping...Ch. 2.1 - When should relative frequencies be used when...Ch. 2.1 - Prob. 31AYUCh. 2.1 - Prob. 32AYUCh. 2.1 - Prob. 33AYUCh. 2.2 - The categories by which data are grouped are...Ch. 2.2 - The _____ class limit is the smallest value within...Ch. 2.2 - The _____ is the difference between consecutive...Ch. 2.2 - Prob. 4AYUCh. 2.2 - Prob. 5AYUCh. 2.2 - Prob. 6AYUCh. 2.2 - True or False: The shape of the distribution shown...Ch. 2.2 - Prob. 8AYUCh. 2.2 - Rolling the Dice An experiment was conducted in...Ch. 2.2 - Car Sales A car salesman records the number of...Ch. 2.2 - IQ Scores The following frequency histogram...Ch. 2.2 - Alcohol-Related Traffic Fatalities The frequency...Ch. 2.2 - In Problems 13 and 14, for each variable...Ch. 2.2 - In Problems 13 and 14, for each variable...Ch. 2.2 - Misery Index The following time-series plot shows...Ch. 2.2 - Prob. 16AYUCh. 2.2 - Predicting School Enrollment To predict future...Ch. 2.2 - Free Throws In an experiment, a researcher asks a...Ch. 2.2 - In Problems 1922, determine the original set of...Ch. 2.2 - In Problems 1922, determine the original set of...Ch. 2.2 - In Problems 1922, determine the original set of...Ch. 2.2 - In Problems 1922, determine the original set of...Ch. 2.2 - find (a) the number of classes, (b) the class...Ch. 2.2 - Earthquakes The following data represent the...Ch. 2.2 - In Problems 25 and 26, construct (a) a relative...Ch. 2.2 - In Problems 25 and 26, construct (a) a relative...Ch. 2.2 - NW Televisions in the Household A researcher with...Ch. 2.2 - Waiting The data below represent the number of...Ch. 2.2 - NW Gini Index The Gini Index is a measure of how...Ch. 2.2 - Average Income The following data represent the...Ch. 2.2 - Cigarette Tex Rates The table shows the tax, in...Ch. 2.2 - Dividend Yield A dividend is a payment from a...Ch. 2.2 - NW Violent Crimes Violent crimes include murder,...Ch. 2.2 - Volume of Altria Group Stock The volume of a stock...Ch. 2.2 - Prob. 35AYUCh. 2.2 - Prob. 36AYUCh. 2.2 - Prob. 37AYUCh. 2.2 - Prob. 38AYUCh. 2.2 - Prob. 39AYUCh. 2.2 - Prob. 40AYUCh. 2.2 - NW Violent Crimes Use the violent crime rate data...Ch. 2.2 - Academy Award Winners The following data represent...Ch. 2.2 - Prob. 43AYUCh. 2.2 - Sullivan Survey Choose a continuous quantitative...Ch. 2.2 - Prob. 46AYUCh. 2.2 - Prob. 47AYUCh. 2.2 - Waiting Draw a dot plot of the waiting data from...Ch. 2.2 - Prob. 49AYUCh. 2.2 - Prob. 50AYUCh. 2.2 - Prob. 51AYUCh. 2.2 - Prob. 52AYUCh. 2.2 - Prob. 53AYUCh. 2.2 - Putting It Together: Which Graphical Summary?...Ch. 2.2 - Prob. 55AYUCh. 2.2 - Prob. 56AYUCh. 2.2 - Discuss the advantages and disadvantages of...Ch. 2.2 - Prob. 58AYUCh. 2.2 - Describe the situations in which it is preferable...Ch. 2.2 - Sketch four histogramsone skewed right, one skewed...Ch. 2.2 - What type of variable is required when drawing...Ch. 2.3 - Inauguration Cost The following is a USA...Ch. 2.3 - Burning Calories The following is a USA Today-type...Ch. 2.3 - NW Median Earnings The graph shows the median...Ch. 2.3 - Union Membership The following relative frequency...Ch. 2.3 - NW Robberies A newspaper article claimed that the...Ch. 2.3 - Car Accidents An article in a student newspaper...Ch. 2.3 - Tax Revenue The following histogram drawn in...Ch. 2.3 - You Explain It! Oil Reserves The U.S. Strategic...Ch. 2.3 - NW Cost of Kids The following is a USA Today-type...Ch. 2.3 - Worker Injury The safety manager at Klutz...Ch. 2.3 - Health Care Expenditures The following data...Ch. 2.3 - Prob. 12AYUCh. 2.3 - NW Overweight Between 1980 and 2012, the number of...Ch. 2.3 - Ideal Family Size The following USA Today-type...Ch. 2.3 - National League Baseball MVP The following pie...Ch. 2.3 - Prob. 16AYUCh. 2 - Effective Commercial Harris Interactive conducted...Ch. 2 - Weapons Used in Homicide The following frequency...Ch. 2 - Live Births The following frequency distribution...Ch. 2 - Political Affiliation One hundred randomly...Ch. 2 - Family Size A random sample of 60 couples married...Ch. 2 - Home Ownership Rates The table shows the home...Ch. 2 - Diameter of a Cookie The following data represent...Ch. 2 - Time Online The following data represent the...Ch. 2 - Grade Inflation The side-by-side bar graph to the...Ch. 2 - Income Distribution The following data represent...Ch. 2 - Misleading Graphs In 2013, the average earnings of...Ch. 2 - High Heels The graphic to the right is a USA Today...Ch. 2 - The graph shows the ratings on Yelp for Hot Dougs...Ch. 2 - A random sample of 1005 adult Americans was asked,...Ch. 2 - Interested in knowing the educational background...Ch. 2 - The following data represent the number of cars...Ch. 2 - Dr. Paul Oswiecmiski randomly selects 40 of his...Ch. 2 - The following data represent the time (in minutes)...Ch. 2 - The data below shows birth rate and per capita...Ch. 2 - The following is a USA Today-type graph. Do you...Ch. 2 - A bar graph or pie chart (or both) that depicts...Ch. 2 - A histogram that displays the distribution of...Ch. 2 - Six histograms displaying tornado duration for...Ch. 2 - A bar chart that shows the relationship between...Ch. 2 - A bar chart that shows the relationship between...Ch. 2 - A general summary of your findings and...
Additional Math Textbook Solutions
Find more solutions based on key concepts
23. A plant nursery sells two sizes of oak trees to landscapers. Large trees cost the nursery $120 from the gro...
College Algebra (Collegiate Math)
Complete each statement with the correct term from the column on the right. Some of the choices may not be used...
Intermediate Algebra (13th Edition)
Provide an example of a qualitative variable and an example of a quantitative variable.
Elementary Statistics ( 3rd International Edition ) Isbn:9781260092561
NOTE: Write your answers using interval notation when appropriate.
CHECKING ANALYTIC SKILLS Fill in each blank ...
Graphical Approach To College Algebra
153. A rain gutter is made from sheets of aluminum that are 20 inches wide. As shown in the figure, the edges ...
College Algebra (7th Edition)
The first derivative of function y=25x4.
Calculus for Business, Economics, Life Sciences, and Social Sciences (14th Edition)
Knowledge Booster


Learn more about
Need a deep-dive on the concept behind this application? Look no further. Learn more about this topic, statistics and related others by exploring similar questions and additional content below.Similar questions
- You want to make a salad from whatever vegetable you have in the fridge. You have seven different tomatoes. There are 2 red tomatoes, 4 yellow tomatoes, and one black tomato in the fridge. You have three different bell peppers. There is 1 red pepper, 1 yellow pepper, and 1 green pepper. What is the probability of randomly choosing a vegetable and getting a red tomato, and a green pepper? Round your answer to four decimal places.arrow_forwarduppose automobile insurance companies gave annual premiums for top-rated companies in several states. The figure below shows box plots for the annual premium for urban customers in three states. Which state offers the lowest premium? Which state offers the highest premium?arrow_forwardWing Foot is a shoe franchise commonly found in shopping centers across the United States. Wing Foot knows that its stores will not show a profit unless they gross over $940,000 per year. Let A be the event that a new Wing Foot store grosses over $940,000 its first year. Let B be the event that a store grosses over $940,000 its second year. Wing Foot has an administrative policy of closing a new store if it does not show a profit in either of the first two years. Assume that the accounting office at Wing Foot provided the following information: 58% of all Wing Foot stores show a profit the first year; 72% of all Wing Foot store show a profit the second year (this includes stores that did not show a profit the first year); however, 86% of Wing Foot stores that showed a profit the first year also showed a profit the second year. Compute P(B|Ac). Round your answer to the nearest hundredth.arrow_forward
- You draw two cards from a standard deck of 52 cards, but before you draw the second card, you put the first one back and reshuffle the deck. If you get a3on the first card, find the probability of drawing a 3 for the second card.arrow_forwardDo bonds reduce the overall risk of an investment portfolio? Let x be a random variable representing annual percent return for the Vanguard Total Stock Index (all Stocks). Let y be a random variable representing annual return for the Vanguard Balanced Index (60% stock and 40% bond). For the past several years, assume the following data. Compute the coefficient of variation for each fund. Round your answers to the nearest tenth. x: 14 0 37 21 35 23 24 -14 -14 -17 y: 8 -2 29 17 22 17 17 -2 -3 -8arrow_forwardWhat percentage of the general U.S. population have bachelor's degrees? Suppose that the Statistical Abstract of the United States, 120th Edition, gives the following percentage of bachelor’s degrees by state. For convenience, the data are sorted in increasing order. 17 18 18 18 19 20 20 20 21 21 21 21 21 22 22 22 22 22 23 23 24 24 24 24 24 25 25 25 25 26 26 26 26 26 26 27 27 27 28 28 28 29 29 31 31 32 32 34 35 38 Illinois has a bachelor's degree percentage rate of about 18%. Into what quartile does this rate fall?arrow_forward
- What percentage of the general U.S. population have bachelor's degrees? Suppose that the Statistical Abstract of the United States, 120th Edition, gives the following percentage of bachelor’s degrees by state. For convenience, the data are sorted in increasing order. 17 18 18 18 19 20 20 20 21 21 21 21 21 22 22 22 22 22 23 23 24 24 24 24 24 25 25 25 25 26 26 26 26 26 26 27 27 27 28 28 28 29 29 31 31 32 32 34 35 38 Illinois has a bachelor's degree percentage rate of about 18%. Into what quartile does this rate fall?arrow_forwardFind the range for the following sample data. x 23 17 11 30 27arrow_forwardDo bonds reduce the overall risk of an investment portfolio? Let x be a random variable representing annual percent return for the Vanguard Total Stock Index (all Stocks). Let y be a random variable representing annual return for the Vanguard Balanced Index (60% stock and 40% bond). For the past several years, assume the following data. Compute the sample mean for x and for y. Round your answer to the nearest tenth. x: 11 0 36 22 34 24 25 -11 -11 -22 y: 9 -3 28 14 23 16 14 -3 -4 -9arrow_forward
- Do bonds reduce the overall risk of an investment portfolio? Let x be a random variable representing annual percent return for the Vanguard Total Stock Index (all Stocks). Let y be a random variable representing annual return for the Vanguard Balanced Index (60% stock and 40% bond). For the past several years, assume the following data. Compute the range for variable y. X 12 0 36 21 35 23 24 -12 -12 -21 Y 10 -2 26 15 22 18 15 -2 -3 -10arrow_forwardDo bonds reduce the overall risk of an investment portfolio? Let x be a random variable representing annual percent return for the Vanguard Total Stock Index (all Stocks). Let y be a random variable representing annual return for the Vanguard Balanced Index (60% stock and 40% bond). For the past several years, assume the following data. Compute the range for variable y. X 12 0 36 21 35 23 24 -12 -12 -21 Y 10 -2 26 15 22 18 15 -2 -3 -10arrow_forwardDo bonds reduce the overall risk of an investment portfolio? Let x be a random variable representing annual percent return for the Vanguard Total Stock Index (all Stocks). Let y be a random variable representing annual return for the Vanguard Balanced Index (60% stock and 40% bond). For the past several years, assume the following data. Compute the range for variable x. X 15 0 37 23 33 25 26 -15 -15 -23 Y 6 -1 28 18 24 17 18 -1 -2 -6arrow_forward
arrow_back_ios
SEE MORE QUESTIONS
arrow_forward_ios
Recommended textbooks for you
 Holt Mcdougal Larson Pre-algebra: Student Edition...AlgebraISBN:9780547587776Author:HOLT MCDOUGALPublisher:HOLT MCDOUGAL
 Glencoe Algebra 1, Student Edition, 9780079039897...AlgebraISBN:9780079039897Author:CarterPublisher:McGraw Hill
 Big Ideas Math A Bridge To Success Algebra 1: Stu...AlgebraISBN:9781680331141Author:HOUGHTON MIFFLIN HARCOURTPublisher:Houghton Mifflin Harcourt
 Functions and Change: A Modeling Approach to Coll...AlgebraISBN:9781337111348Author:Bruce Crauder, Benny Evans, Alan NoellPublisher:Cengage Learning
Holt Mcdougal Larson Pre-algebra: Student Edition...
Algebra
ISBN:9780547587776
Author:HOLT MCDOUGAL
Publisher:HOLT MCDOUGAL
Glencoe Algebra 1, Student Edition, 9780079039897...
Algebra
ISBN:9780079039897
Author:Carter
Publisher:McGraw Hill
Big Ideas Math A Bridge To Success Algebra 1: Stu...
Algebra
ISBN:9781680331141
Author:HOUGHTON MIFFLIN HARCOURT
Publisher:Houghton Mifflin Harcourt
Functions and Change: A Modeling Approach to Coll...
Algebra
ISBN:9781337111348
Author:Bruce Crauder, Benny Evans, Alan Noell
Publisher:Cengage Learning
Chi Square test; Author: Vectors Academy;https://www.youtube.com/watch?v=f53nXHoMXx4;License: Standard YouTube License, CC-BY