Concept explainers
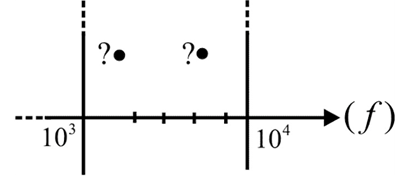
- Determine the frequencies (in kHz) at the points indicated on the plot in Fig. 22.104(a).
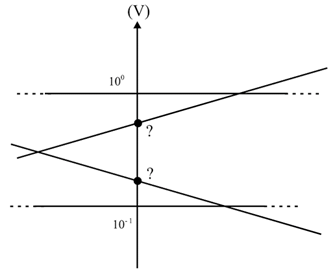
- Determine the voltages (in mV) at the points indicated on the plot in Fig. 22.104(b).


(a)
The frequencies at the points indicated in the plot
Answer to Problem 1P
The frequencies at the points are
Explanation of Solution
Given:

Formula used:
The frequency at the point is calculated by
Calculation:
The distance of the first point,
The distance between two vertical axes is
The value of the first point,
The value of the first point is
The values of the second point is,
The value of the second point is
Conclusion:
Thus, the value of the first point is
(b)
The voltages at the points indicated on the plot
Answer to Problem 1P
The voltage of the top point is 527.5mVand the bottom point is 181.7mV
Explanation of Solution
Given:

Formula used:
The voltage at the point is calculated by
Calculation:
The total length of the vertical axis is,
Using a scale on the vertical axis, from the plot, we can find that the top and bottom points are at a fractionof total length of the vertical axis from the bottom.
The voltage value of the top point is
The voltage of the top point is 527.5mV
The voltage value of the bottom point is
The voltage of the bottom point is 181.7mV
Conclusion:
Thus, the voltage of the top point is 527.5mVand the voltage of the bottom point is 181.7mV
Want to see more full solutions like this?
Chapter 22 Solutions
Introductory Circuit Analysis; Laboratory Manual For Introductory Circuit Analysis Format: Kit/package/shrinkwrap
Additional Engineering Textbook Solutions
Java: An Introduction to Problem Solving and Programming (8th Edition)
Modern Database Management
Thermodynamics: An Engineering Approach
Electric Circuits. (11th Edition)
Database Concepts (8th Edition)
- Find the step response of each of the transfer functions shown in Eqs. (4.62) through (4.64) and compare them. [Shown in the image]Book: Norman S. Nise - Control Systems Engineering, 6th EditionTopic: Chapter-4: Time Response, Example 4.8Solve the math with proper explanation. Please don't give AI response. Asking for a expert verified answer.arrow_forward2. With respect to the circuit shown in Figure 2 below V2 -R1 R2 R4 w R3 R5 Figure 2: DC Circuit 2 a. Using Ohm's and Kirchhoff's laws calculate the current flowing through R3 and so determine wattage rating of R3. b. Verify your results with simulations. Note: you must use the values for the components in Table 2. Table 2 V2 (Volts) R1 (KQ) R2 (KQ) R3 (KQ) R4 (KQ) R5 (KQ) 9 3.3 5 10 6 1 3.3arrow_forwardDon't use ai to answer i will report your answerarrow_forward
- Don't use ai to answer I will report you answerarrow_forwardcircuit value of i1 and i2arrow_forwardIn the circuit shown in the figure, the switch opens at time t = 0. For t≥ 0 use I(t) and V₁(t) or Find Vc(t) and lc(t). D to icht) w 43 ViLC+) + vc(+) 5. F + 1252 18 A 3) 2H2VLCH 8 V 4л warrow_forward
- Q1/obtain the transfer function for the block diagram shown in the figure below: G4 Garrow_forwardQ4. Complete the missing readings (value and direction) in this table based on the circle shown below. With the presence of exporters With the presence of source 287 I₁ I2 13 4A. In the presence of the source 77 I.A 2A 28V= M ww 13 + tw 4A =7Varrow_forwardNo chatgpt pls will upvotearrow_forward
 Power System Analysis and Design (MindTap Course ...Electrical EngineeringISBN:9781305632134Author:J. Duncan Glover, Thomas Overbye, Mulukutla S. SarmaPublisher:Cengage Learning
