
(a)
To graph:
A histogram for the given data.
(a)
Explanation of Solution
Given information:
| Hourly Wage at First Job (in Dollars) | |
| Class | Frequency |
| 12 | |
| 50 | |
| 48 | |
| 45 | |
| 34 | |
Formula used:
Class mid-point
For adjustment of class boundaries subtract
Calculation:
Compute the class mid-point of each class.
For the class
For the class
For the class
For the class
For the class
Calculate the adjustment factor.
Construct the table with adjusted class boundary and class mid-point.
| Age at time of First Marriage (in Years) | ||
| Class boundary | Mid-point | Frequency |
| 7.995 | 12 | |
| 8.995 | 50 | |
| 9.995 | 48 | |
| 10.995 | 45 | |
| 11.995 | 34 | |
Table 1
Graph:
Construct the histogram corresponding to the table 1.
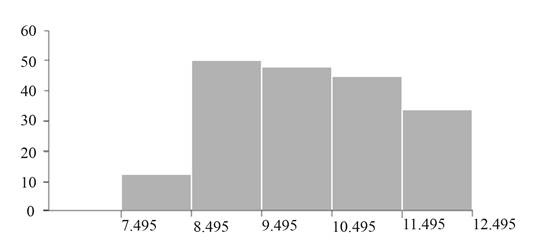
Figure 1
Interpretation:
Figure 1 represents the histogram for the given data.
A histogram is a bar graph of a frequency distribution of quantitative data.
Put classes along
(b)
To calculate:
The relative frequency for each class.
(b)
Answer to Problem 11E
Solution:
Required relative frequency table is,
| Class | Relative Frequency |
Explanation of Solution
Given information:
| Hourly Wage at First Job (in Dollars) | |
| Class | Frequency |
| 12 | |
| 50 | |
| 48 | |
| 45 | |
| 34 | |
Formula used:
Relative Frequency
Calculation:
Compute
Compute relative frequencies for each class in the following table.
| Class | Frequency | Relative Frequency |
| 12 | ||
| 50 | ||
| 48 | ||
| 45 | ||
| 34 |
Table 2
Conclusion:
Thus, the required relative frequency table is,
| Class | Relative Frequency |
(c)
To graph:
A relative frequency histogram for the given data.
(c)
Explanation of Solution
Given information:
| Hourly Wage at First Job (in Dollars) | |
| Class | Relative Frequency |
Formula used:
Class mid-point
For adjustment of class boundaries subtract
Calculation:
Compute the class mid-point for each class.
For the class
For the class
For the class
For the class
For the class
Calculate the adjustment factor.
Construct the table with adjusted class boundary and class mid-point.
| Age at time of First Marriage (in Years) | ||
| Class boundary | Mid-point | Relative Frequency |
| 7.995 | ||
| 8.995 | ||
| 9.995 | ||
| 10.995 | ||
| 11.995 | ||
Table 3
Graph:
Construct the histogram corresponding to the table 3.

Figure 2
Interpretation:
Figure 2 represents the relative frequency histogram for the given data.
A histogram is a bar graph of a frequency distribution of quantitative data.
Put classes along
Want to see more full solutions like this?
Chapter 2 Solutions
Beginning Statistics, 2nd Edition

- A company found that the daily sales revenue of its flagship product follows a normal distribution with a mean of $4500 and a standard deviation of $450. The company defines a "high-sales day" that is, any day with sales exceeding $4800. please provide a step by step on how to get the answers in excel Q: What percentage of days can the company expect to have "high-sales days" or sales greater than $4800? Q: What is the sales revenue threshold for the bottom 10% of days? (please note that 10% refers to the probability/area under bell curve towards the lower tail of bell curve) Provide answers in the yellow cellsarrow_forwardFind the critical value for a left-tailed test using the F distribution with a 0.025, degrees of freedom in the numerator=12, and degrees of freedom in the denominator = 50. A portion of the table of critical values of the F-distribution is provided. Click the icon to view the partial table of critical values of the F-distribution. What is the critical value? (Round to two decimal places as needed.)arrow_forwardA retail store manager claims that the average daily sales of the store are $1,500. You aim to test whether the actual average daily sales differ significantly from this claimed value. You can provide your answer by inserting a text box and the answer must include: Null hypothesis, Alternative hypothesis, Show answer (output table/summary table), and Conclusion based on the P value. Showing the calculation is a must. If calculation is missing,so please provide a step by step on the answers Numerical answers in the yellow cellsarrow_forward
 MATLAB: An Introduction with ApplicationsStatisticsISBN:9781119256830Author:Amos GilatPublisher:John Wiley & Sons Inc
 Probability and Statistics for Engineering and th...StatisticsISBN:9781305251809Author:Jay L. DevorePublisher:Cengage Learning
 Statistics for The Behavioral Sciences (MindTap C...StatisticsISBN:9781305504912Author:Frederick J Gravetter, Larry B. WallnauPublisher:Cengage Learning
 Elementary Statistics: Picturing the World (7th E...StatisticsISBN:9780134683416Author:Ron Larson, Betsy FarberPublisher:PEARSON
 The Basic Practice of StatisticsStatisticsISBN:9781319042578Author:David S. Moore, William I. Notz, Michael A. FlignerPublisher:W. H. Freeman
 Introduction to the Practice of StatisticsStatisticsISBN:9781319013387Author:David S. Moore, George P. McCabe, Bruce A. CraigPublisher:W. H. Freeman