Videos
Modeling Data
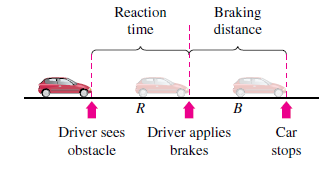
The stopping distance of an automobile, on dry, level pavement, traveling at a speed v (in kilometers per hour)is the distance R (in meters) the car travels during the reaction time of the driver plus die distance B (in meters)the car travels after the brakes are applied (see figure).The table shows the results of an experiment.
| Speed, v | 20 | 40 | 60 | 80 | 100 |
| Reaction Time Distance, R | 8.3 | 16.7 | 25.0 | 33.3 | 41.7 |
| Braking Time Distance, B | 2.3 | 9.0 | 20.2 | 35.8 | 55.9 |

(a) Use the regression capabilities of a graphing utility to find a linear model for reaction time distance R.
(b) Use the regression capabilities of a graphing utility to find a quadratic model for braking time distance B.
(c) Determine the polynomial giving the total stopping distance T.
(d) Use a graphing utility to graph the functions R, B, and T in the same viewing window.
(e) Find the derivative of T and the rates of change of the total stopping distance for v = 40, v = 80, and v = 100.
(f) Use the results of this exercise to draw conclusions about the total stopping distance as speed increases.

Trending nowThis is a popular solution!

Chapter 2 Solutions
Calculus Loose Leaf Bundle W/webassign


 Big Ideas Math A Bridge To Success Algebra 1: Stu...AlgebraISBN:9781680331141Author:HOUGHTON MIFFLIN HARCOURTPublisher:Houghton Mifflin Harcourt
 Holt Mcdougal Larson Pre-algebra: Student Edition...AlgebraISBN:9780547587776Author:HOLT MCDOUGALPublisher:HOLT MCDOUGAL
 Glencoe Algebra 1, Student Edition, 9780079039897...AlgebraISBN:9780079039897Author:CarterPublisher:McGraw Hill
 Trigonometry (MindTap Course List)TrigonometryISBN:9781337278461Author:Ron LarsonPublisher:Cengage Learning