
MyLab Statistics with Pearson eText -- Standalone Access Card -- for Fundamentals of Statistics
5th Edition
ISBN: 9780134743295
Author: Michael III Sullivan
Publisher: PEARSON
expand_more
expand_more
format_list_bulleted
Videos
Textbook Question
Chapter 2.1, Problem 7AYU
Most Valuable Player The following Pareto chart shows the position played by the most valuable player (MVP) in the National League since 1931. Source: http://www.baseball-almanac.com/
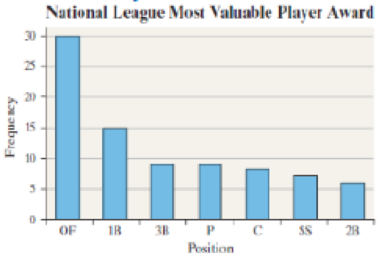
- a. Which position had the most MVPs?
- b. How many MVPs played first base (1B)?
- c. How many more MVPs played outfield (OF) than first base?
- d. There are three outfield positions (left field, center field, right field). Given this, how might the graph be misleading?
Expert Solution & Answer
Want to see the full answer?
Check out a sample textbook solution
Students have asked these similar questions
Suppose you know that Bob's test score is
above the mean, but he doesn't remember by
how much. At least how many students must
score lower than Bob?
If a baby's weight is at the median, what's
her percentile?
At the same restaurant as in Question 19 with
the same normal distribution, what's the
chance of it taking no more than 15 minutes
to get service?
Chapter 2 Solutions
MyLab Statistics with Pearson eText -- Standalone Access Card -- for Fundamentals of Statistics
Ch. 2.1 - Define raw data in your own words.Ch. 2.1 - A frequency distribution lists the _____ of...Ch. 2.1 - In a relative frequency distribution, what should...Ch. 2.1 - What is a bar graph? What is a Pareto chart?Ch. 2.1 - Flu Season The pie chart shown, the type we see in...Ch. 2.1 - Cosmetic Surgery This USA Today type chart shows...Ch. 2.1 - Most Valuable Player The following Pareto chart...Ch. 2.1 - Poverty The U.S. Census Bureau uses money income...Ch. 2.1 - Divorce The following graph represents the results...Ch. 2.1 - Identity Theft Identity fraud occurs when someone...
Ch. 2.1 - Made in America A random sample of 2163 adults...Ch. 2.1 - Desirability Attributes A random sample of 2163...Ch. 2.1 - College Survey In a national survey conducted by...Ch. 2.1 - College Survey In a national survey conducted by...Ch. 2.1 - Use the Internet? The Gallup organization...Ch. 2.1 - Dining Out A sample of 521 adults was asked, How...Ch. 2.1 - NW Texting A survey of U.S. adults and teens (ages...Ch. 2.1 - Educational Attainment The educational attainment...Ch. 2.1 - Dream Job A survey of adult men and women asked,...Ch. 2.1 - Car Color A survey of 100 randomly selected autos...Ch. 2.1 - Prob. 21AYUCh. 2.1 - Bachelor Party In a survey conducted by Opinion...Ch. 2.1 - Favorite Day to Eat Out A survey was conducted by...Ch. 2.1 - Prob. 25AYUCh. 2.1 - Prob. 26AYUCh. 2.1 - Prob. 27AYUCh. 2.1 - StatCrunch Survey Choose a qualitative variable...Ch. 2.1 - Putting It Together: Online Homework Keeping...Ch. 2.1 - When should relative frequencies be used when...Ch. 2.1 - Prob. 31AYUCh. 2.1 - Prob. 32AYUCh. 2.1 - Prob. 33AYUCh. 2.2 - The categories by which data are grouped are...Ch. 2.2 - The _____ class limit is the smallest value within...Ch. 2.2 - The _____ is the difference between consecutive...Ch. 2.2 - Prob. 4AYUCh. 2.2 - Prob. 5AYUCh. 2.2 - Prob. 6AYUCh. 2.2 - True or False: The shape of the distribution shown...Ch. 2.2 - Prob. 8AYUCh. 2.2 - Rolling the Dice An experiment was conducted in...Ch. 2.2 - Car Sales A car salesman records the number of...Ch. 2.2 - IQ Scores The following frequency histogram...Ch. 2.2 - Alcohol-Related Traffic Fatalities The frequency...Ch. 2.2 - In Problems 13 and 14, for each variable...Ch. 2.2 - In Problems 13 and 14, for each variable...Ch. 2.2 - Misery Index The following time-series plot shows...Ch. 2.2 - Prob. 16AYUCh. 2.2 - Predicting School Enrollment To predict future...Ch. 2.2 - Free Throws In an experiment, a researcher asks a...Ch. 2.2 - In Problems 1922, determine the original set of...Ch. 2.2 - In Problems 1922, determine the original set of...Ch. 2.2 - In Problems 1922, determine the original set of...Ch. 2.2 - In Problems 1922, determine the original set of...Ch. 2.2 - find (a) the number of classes, (b) the class...Ch. 2.2 - Earthquakes The following data represent the...Ch. 2.2 - In Problems 25 and 26, construct (a) a relative...Ch. 2.2 - In Problems 25 and 26, construct (a) a relative...Ch. 2.2 - NW Televisions in the Household A researcher with...Ch. 2.2 - Waiting The data below represent the number of...Ch. 2.2 - NW Gini Index The Gini Index is a measure of how...Ch. 2.2 - Average Income The following data represent the...Ch. 2.2 - Cigarette Tex Rates The table shows the tax, in...Ch. 2.2 - Dividend Yield A dividend is a payment from a...Ch. 2.2 - NW Violent Crimes Violent crimes include murder,...Ch. 2.2 - Volume of Altria Group Stock The volume of a stock...Ch. 2.2 - Prob. 35AYUCh. 2.2 - Prob. 36AYUCh. 2.2 - Prob. 37AYUCh. 2.2 - Prob. 38AYUCh. 2.2 - Prob. 39AYUCh. 2.2 - Prob. 40AYUCh. 2.2 - NW Violent Crimes Use the violent crime rate data...Ch. 2.2 - Academy Award Winners The following data represent...Ch. 2.2 - Prob. 43AYUCh. 2.2 - Sullivan Survey Choose a continuous quantitative...Ch. 2.2 - Prob. 46AYUCh. 2.2 - Prob. 47AYUCh. 2.2 - Waiting Draw a dot plot of the waiting data from...Ch. 2.2 - Prob. 49AYUCh. 2.2 - Prob. 50AYUCh. 2.2 - Prob. 51AYUCh. 2.2 - Prob. 52AYUCh. 2.2 - Prob. 53AYUCh. 2.2 - Putting It Together: Which Graphical Summary?...Ch. 2.2 - Prob. 55AYUCh. 2.2 - Prob. 56AYUCh. 2.2 - Discuss the advantages and disadvantages of...Ch. 2.2 - Prob. 58AYUCh. 2.2 - Describe the situations in which it is preferable...Ch. 2.2 - Sketch four histogramsone skewed right, one skewed...Ch. 2.2 - What type of variable is required when drawing...Ch. 2.3 - Inauguration Cost The following is a USA...Ch. 2.3 - Burning Calories The following is a USA Today-type...Ch. 2.3 - NW Median Earnings The graph shows the median...Ch. 2.3 - Union Membership The following relative frequency...Ch. 2.3 - NW Robberies A newspaper article claimed that the...Ch. 2.3 - Car Accidents An article in a student newspaper...Ch. 2.3 - Tax Revenue The following histogram drawn in...Ch. 2.3 - You Explain It! Oil Reserves The U.S. Strategic...Ch. 2.3 - NW Cost of Kids The following is a USA Today-type...Ch. 2.3 - Worker Injury The safety manager at Klutz...Ch. 2.3 - Health Care Expenditures The following data...Ch. 2.3 - Prob. 12AYUCh. 2.3 - NW Overweight Between 1980 and 2012, the number of...Ch. 2.3 - Ideal Family Size The following USA Today-type...Ch. 2.3 - National League Baseball MVP The following pie...Ch. 2.3 - Prob. 16AYUCh. 2 - Effective Commercial Harris Interactive conducted...Ch. 2 - Weapons Used in Homicide The following frequency...Ch. 2 - Live Births The following frequency distribution...Ch. 2 - Political Affiliation One hundred randomly...Ch. 2 - Family Size A random sample of 60 couples married...Ch. 2 - Home Ownership Rates The table shows the home...Ch. 2 - Diameter of a Cookie The following data represent...Ch. 2 - Time Online The following data represent the...Ch. 2 - Grade Inflation The side-by-side bar graph to the...Ch. 2 - Income Distribution The following data represent...Ch. 2 - Misleading Graphs In 2013, the average earnings of...Ch. 2 - High Heels The graphic to the right is a USA Today...Ch. 2 - The graph shows the ratings on Yelp for Hot Dougs...Ch. 2 - A random sample of 1005 adult Americans was asked,...Ch. 2 - Interested in knowing the educational background...Ch. 2 - The following data represent the number of cars...Ch. 2 - Dr. Paul Oswiecmiski randomly selects 40 of his...Ch. 2 - The following data represent the time (in minutes)...Ch. 2 - The data below shows birth rate and per capita...Ch. 2 - The following is a USA Today-type graph. Do you...Ch. 2 - A bar graph or pie chart (or both) that depicts...Ch. 2 - A histogram that displays the distribution of...Ch. 2 - Six histograms displaying tornado duration for...Ch. 2 - A bar chart that shows the relationship between...Ch. 2 - A bar chart that shows the relationship between...Ch. 2 - A general summary of your findings and...
Knowledge Booster


Learn more about
Need a deep-dive on the concept behind this application? Look no further. Learn more about this topic, statistics and related others by exploring similar questions and additional content below.Similar questions
- Clint, obviously not in college, sleeps an average of 8 hours per night with a standard deviation of 15 minutes. What's the chance of him sleeping between 7.5 and 8.5 hours on any given night? 0-(7-0) 200 91109s and doiw $20 (8-0) mol 8520 slang $199 galbrog seam side pide & D (newid se od poyesvig as PELEO PER AFTE editiw noudab temand van Czarrow_forwardTimes to complete a statistics exam have a normal distribution with a mean of 40 minutes and standard deviation of 6 minutes. Deshawn's time comes in at the 90th percentile. What percentage of the students are still working on their exams when Deshawn leaves?arrow_forwardSuppose that the weights of cereal boxes have a normal distribution with a mean of 20 ounces and standard deviation of half an ounce. A box that has a standard score of o weighs how much? syed by ilog ni 21arrow_forward
- Bob scores 80 on both his math exam (which has a mean of 70 and standard deviation of 10) and his English exam (which has a mean of 85 and standard deviation of 5). Find and interpret Bob's Z-scores on both exams to let him know which exam (if either) he did bet- ter on. Don't, however, let his parents know; let them think he's just as good at both subjects. algas 70) sering digarrow_forwardSue's math class exam has a mean of 70 with a standard deviation of 5. Her standard score is-2. What's her original exam score?arrow_forwardClint sleeps an average of 8 hours per night with a standard deviation of 15 minutes. What's the chance he will sleep less than 7.5 hours tonight? nut bow visarrow_forward
- Suppose that your score on an exam is directly at the mean. What's your standard score?arrow_forwardOne state's annual rainfall has a normal dis- tribution with a mean of 100 inches and standard deviation of 25 inches. Suppose that corn grows best when the annual rainfall is between 100 and 150 inches. What's the chance of achieving this amount of rainfall? wved now of sociarrow_forward13 Suppose that your exam score has a standard score of 0.90. Does this mean that 90 percent of the other exam scores are lower than yours?arrow_forward
- Bob's commuting times to work have a nor- mal distribution with a mean of 45 minutes and standard deviation of 10 minutes. How often does Bob get to work in 30 to 45 minutes?arrow_forwardBob's commuting times to work have a nor- mal distribution with a mean of 45 minutes and standard deviation of 10 minutes. a. What percentage of the time does Bob get to work in 30 minutes or less? b. Bob's workday starts at 9 a.m. If he leaves at 8 a.m., how often is he late?arrow_forwardSuppose that you want to put fat Fido on a weight-loss program. Before the program, his weight had a standard score of +2 com- pared to dogs of his breed/age, and after the program, his weight has a standard score of -2. His weight before the program was 150 pounds, and the standard deviation for the breed is 5 pounds. a. What's the mean weight for Fido's breed/ age? b. What's his weight after the weight-loss program?arrow_forward
arrow_back_ios
SEE MORE QUESTIONS
arrow_forward_ios
Recommended textbooks for you
 Big Ideas Math A Bridge To Success Algebra 1: Stu...AlgebraISBN:9781680331141Author:HOUGHTON MIFFLIN HARCOURTPublisher:Houghton Mifflin Harcourt
 Glencoe Algebra 1, Student Edition, 9780079039897...AlgebraISBN:9780079039897Author:CarterPublisher:McGraw Hill
 Holt Mcdougal Larson Pre-algebra: Student Edition...AlgebraISBN:9780547587776Author:HOLT MCDOUGALPublisher:HOLT MCDOUGAL
 College Algebra (MindTap Course List)AlgebraISBN:9781305652231Author:R. David Gustafson, Jeff HughesPublisher:Cengage Learning
 Functions and Change: A Modeling Approach to Coll...AlgebraISBN:9781337111348Author:Bruce Crauder, Benny Evans, Alan NoellPublisher:Cengage Learning
Big Ideas Math A Bridge To Success Algebra 1: Stu...
Algebra
ISBN:9781680331141
Author:HOUGHTON MIFFLIN HARCOURT
Publisher:Houghton Mifflin Harcourt
Glencoe Algebra 1, Student Edition, 9780079039897...
Algebra
ISBN:9780079039897
Author:Carter
Publisher:McGraw Hill
Holt Mcdougal Larson Pre-algebra: Student Edition...
Algebra
ISBN:9780547587776
Author:HOLT MCDOUGAL
Publisher:HOLT MCDOUGAL
College Algebra (MindTap Course List)
Algebra
ISBN:9781305652231
Author:R. David Gustafson, Jeff Hughes
Publisher:Cengage Learning
Functions and Change: A Modeling Approach to Coll...
Algebra
ISBN:9781337111348
Author:Bruce Crauder, Benny Evans, Alan Noell
Publisher:Cengage Learning
Introduction to Statistical Quality Control (SQC); Author: FORSEdu;https://www.youtube.com/watch?v=c18FKHUDZv8;License: Standard YouTube License, CC-BY
[DAXX] Introduction to Statistical Quality Control; Author: The Academician;https://www.youtube.com/watch?v=ypZGDxjSM60;License: Standard Youtube License