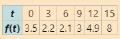
The funding f t in $ millions for a drug rehabilitation center is given in the table for selected years t . a. Use regression to find a quadratic function to model the data. b. During what year is the funding the least? Round to the nearest year. c. What is the minimum yearly amount of funding received? Round to the nearest million.
The funding f t in $ millions for a drug rehabilitation center is given in the table for selected years t . a. Use regression to find a quadratic function to model the data. b. During what year is the funding the least? Round to the nearest year. c. What is the minimum yearly amount of funding received? Round to the nearest million.
Solution Summary: The author explains the quadratic expression using the regression method to model the given data.
Consider the function f(x) = x²-1.
(a) Find the instantaneous rate of change of f(x) at x=1 using the definition of the derivative.
Show all your steps clearly.
(b) Sketch the graph of f(x) around x = 1. Draw the secant line passing through the points on the
graph where x 1 and x->
1+h (for a small positive value of h, illustrate conceptually). Then,
draw the tangent line to the graph at x=1. Explain how the slope of the tangent line relates to the
value you found in part (a).
(c) In a few sentences, explain what the instantaneous rate of change of f(x) at x = 1 represents in
the context of the graph of f(x). How does the rate of change of this function vary at different
points?
1. The graph of ƒ is given. Use the graph to evaluate each of the following values. If a value does not exist,
state that fact.
и
(a) f'(-5)
(b) f'(-3)
(c) f'(0)
(d) f'(5)
2. Find an equation of the tangent line to the graph of y = g(x) at x = 5 if g(5) = −3 and g'(5)
=
4.
-
3. If an equation of the tangent line to the graph of y = f(x) at the point where x 2 is y = 4x — 5, find ƒ(2)
and f'(2).
Elementary Statistics: Picturing the World (7th Edition)
Knowledge Booster
Learn more about
Need a deep-dive on the concept behind this application? Look no further. Learn more about this topic, calculus and related others by exploring similar questions and additional content below.
Correlation Vs Regression: Difference Between them with definition & Comparison Chart; Author: Key Differences;https://www.youtube.com/watch?v=Ou2QGSJVd0U;License: Standard YouTube License, CC-BY
Correlation and Regression: Concepts with Illustrative examples; Author: LEARN & APPLY : Lean and Six Sigma;https://www.youtube.com/watch?v=xTpHD5WLuoA;License: Standard YouTube License, CC-BY


 College Algebra (MindTap Course List)AlgebraISBN:9781305652231Author:R. David Gustafson, Jeff HughesPublisher:Cengage Learning
 Glencoe Algebra 1, Student Edition, 9780079039897...AlgebraISBN:9780079039897Author:CarterPublisher:McGraw Hill
 Algebra & Trigonometry with Analytic GeometryAlgebraISBN:9781133382119Author:SwokowskiPublisher:Cengage
 Algebra and Trigonometry (MindTap Course List)AlgebraISBN:9781305071742Author:James Stewart, Lothar Redlin, Saleem WatsonPublisher:Cengage Learning
 Functions and Change: A Modeling Approach to Coll...AlgebraISBN:9781337111348Author:Bruce Crauder, Benny Evans, Alan NoellPublisher:Cengage Learning