
Fundamentals of Statistics, Books a la Carte Edition Plus MyLab Statistics with Pearson eText -- Access Card Package (5th Edition)
5th Edition
ISBN: 9780134763699
Author: Michael Sullivan III
Publisher: PEARSON
expand_more
expand_more
format_list_bulleted
Videos
Textbook Question
Chapter 2.1, Problem 5AYU
Flu Season The pie chart shown, the type we see in USA Today, depicts the approaches people use to avoid getting the flu.
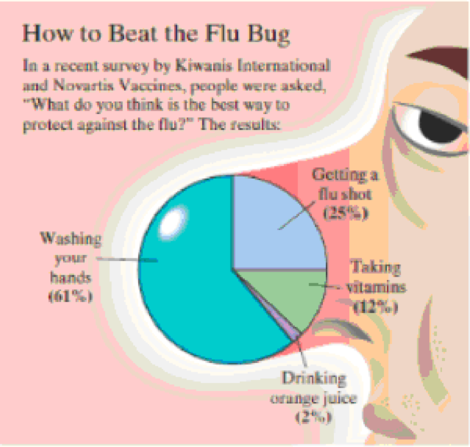
Source: Kiwanis International and Novartis Vaccines
- a. What is the most common approach? What percentage of the population chooses this method?
- b. What is the least used approach? What percentage of the population chooses this method?
- c. What percentage of the population thinks flu shots are the best way to beat the flu?
Expert Solution & Answer
Want to see the full answer?
Check out a sample textbook solution
Students have asked these similar questions
30. An individual who has automobile insurance from a certain company is randomly selected. Let Y be the num- ber of moving violations for which the individual was cited during the last 3 years. The pmf of Y isy | 1 2 4 8 16p(y) | .05 .10 .35 .40 .10
a.Compute E(Y).b. Suppose an individual with Y violations incurs a surcharge of $100Y^2. Calculate the expected amount of the surcharge.
24. An insurance company offers its policyholders a num- ber of different premium payment options. For a ran- domly selected policyholder, let X = the number of months between successive payments. The cdf of X is as follows:
F(x)=0.00 : x < 10.30 : 1≤x<30.40 : 3≤ x < 40.45 : 4≤ x <60.60 : 6≤ x < 121.00 : 12≤ x
a. What is the pmf of X?b. Using just the cdf, compute P(3≤ X ≤6) and P(4≤ X).
59. At a certain gas station, 40% of the customers use regular gas (A1), 35% use plus gas (A2), and 25% use premium (A3). Of those customers using regular gas, only 30% fill their tanks (event B). Of those customers using plus, 60% fill their tanks, whereas of those using premium, 50% fill their tanks.a. What is the probability that the next customer will request plus gas and fill the tank (A2 B)?b. What is the probability that the next customer fills the tank?c. If the next customer fills the tank, what is the probability that regular gas is requested? Plus? Premium?
Chapter 2 Solutions
Fundamentals of Statistics, Books a la Carte Edition Plus MyLab Statistics with Pearson eText -- Access Card Package (5th Edition)
Ch. 2.1 - Define raw data in your own words.Ch. 2.1 - A frequency distribution lists the _____ of...Ch. 2.1 - In a relative frequency distribution, what should...Ch. 2.1 - What is a bar graph? What is a Pareto chart?Ch. 2.1 - Flu Season The pie chart shown, the type we see in...Ch. 2.1 - Cosmetic Surgery This USA Today type chart shows...Ch. 2.1 - Most Valuable Player The following Pareto chart...Ch. 2.1 - Poverty The U.S. Census Bureau uses money income...Ch. 2.1 - Divorce The following graph represents the results...Ch. 2.1 - Identity Theft Identity fraud occurs when someone...
Ch. 2.1 - Made in America A random sample of 2163 adults...Ch. 2.1 - Desirability Attributes A random sample of 2163...Ch. 2.1 - College Survey In a national survey conducted by...Ch. 2.1 - College Survey In a national survey conducted by...Ch. 2.1 - Use the Internet? The Gallup organization...Ch. 2.1 - Dining Out A sample of 521 adults was asked, How...Ch. 2.1 - NW Texting A survey of U.S. adults and teens (ages...Ch. 2.1 - Educational Attainment The educational attainment...Ch. 2.1 - Dream Job A survey of adult men and women asked,...Ch. 2.1 - Car Color A survey of 100 randomly selected autos...Ch. 2.1 - Prob. 21AYUCh. 2.1 - Bachelor Party In a survey conducted by Opinion...Ch. 2.1 - Favorite Day to Eat Out A survey was conducted by...Ch. 2.1 - Prob. 25AYUCh. 2.1 - Prob. 26AYUCh. 2.1 - Prob. 27AYUCh. 2.1 - StatCrunch Survey Choose a qualitative variable...Ch. 2.1 - Putting It Together: Online Homework Keeping...Ch. 2.1 - When should relative frequencies be used when...Ch. 2.1 - Prob. 31AYUCh. 2.1 - Prob. 32AYUCh. 2.1 - Prob. 33AYUCh. 2.2 - The categories by which data are grouped are...Ch. 2.2 - The _____ class limit is the smallest value within...Ch. 2.2 - The _____ is the difference between consecutive...Ch. 2.2 - Prob. 4AYUCh. 2.2 - Prob. 5AYUCh. 2.2 - Prob. 6AYUCh. 2.2 - True or False: The shape of the distribution shown...Ch. 2.2 - Prob. 8AYUCh. 2.2 - Rolling the Dice An experiment was conducted in...Ch. 2.2 - Car Sales A car salesman records the number of...Ch. 2.2 - IQ Scores The following frequency histogram...Ch. 2.2 - Alcohol-Related Traffic Fatalities The frequency...Ch. 2.2 - In Problems 13 and 14, for each variable...Ch. 2.2 - In Problems 13 and 14, for each variable...Ch. 2.2 - Misery Index The following time-series plot shows...Ch. 2.2 - Prob. 16AYUCh. 2.2 - Predicting School Enrollment To predict future...Ch. 2.2 - Free Throws In an experiment, a researcher asks a...Ch. 2.2 - In Problems 1922, determine the original set of...Ch. 2.2 - In Problems 1922, determine the original set of...Ch. 2.2 - In Problems 1922, determine the original set of...Ch. 2.2 - In Problems 1922, determine the original set of...Ch. 2.2 - find (a) the number of classes, (b) the class...Ch. 2.2 - Earthquakes The following data represent the...Ch. 2.2 - In Problems 25 and 26, construct (a) a relative...Ch. 2.2 - In Problems 25 and 26, construct (a) a relative...Ch. 2.2 - NW Televisions in the Household A researcher with...Ch. 2.2 - Waiting The data below represent the number of...Ch. 2.2 - NW Gini Index The Gini Index is a measure of how...Ch. 2.2 - Average Income The following data represent the...Ch. 2.2 - Cigarette Tex Rates The table shows the tax, in...Ch. 2.2 - Dividend Yield A dividend is a payment from a...Ch. 2.2 - NW Violent Crimes Violent crimes include murder,...Ch. 2.2 - Volume of Altria Group Stock The volume of a stock...Ch. 2.2 - Prob. 35AYUCh. 2.2 - Prob. 36AYUCh. 2.2 - Prob. 37AYUCh. 2.2 - Prob. 38AYUCh. 2.2 - Prob. 39AYUCh. 2.2 - Prob. 40AYUCh. 2.2 - NW Violent Crimes Use the violent crime rate data...Ch. 2.2 - Academy Award Winners The following data represent...Ch. 2.2 - Prob. 43AYUCh. 2.2 - Sullivan Survey Choose a continuous quantitative...Ch. 2.2 - Prob. 46AYUCh. 2.2 - Prob. 47AYUCh. 2.2 - Waiting Draw a dot plot of the waiting data from...Ch. 2.2 - Prob. 49AYUCh. 2.2 - Prob. 50AYUCh. 2.2 - Prob. 51AYUCh. 2.2 - Prob. 52AYUCh. 2.2 - Prob. 53AYUCh. 2.2 - Putting It Together: Which Graphical Summary?...Ch. 2.2 - Prob. 55AYUCh. 2.2 - Prob. 56AYUCh. 2.2 - Discuss the advantages and disadvantages of...Ch. 2.2 - Prob. 58AYUCh. 2.2 - Describe the situations in which it is preferable...Ch. 2.2 - Sketch four histogramsone skewed right, one skewed...Ch. 2.2 - What type of variable is required when drawing...Ch. 2.3 - Inauguration Cost The following is a USA...Ch. 2.3 - Burning Calories The following is a USA Today-type...Ch. 2.3 - NW Median Earnings The graph shows the median...Ch. 2.3 - Union Membership The following relative frequency...Ch. 2.3 - NW Robberies A newspaper article claimed that the...Ch. 2.3 - Car Accidents An article in a student newspaper...Ch. 2.3 - Tax Revenue The following histogram drawn in...Ch. 2.3 - You Explain It! Oil Reserves The U.S. Strategic...Ch. 2.3 - NW Cost of Kids The following is a USA Today-type...Ch. 2.3 - Worker Injury The safety manager at Klutz...Ch. 2.3 - Health Care Expenditures The following data...Ch. 2.3 - Prob. 12AYUCh. 2.3 - NW Overweight Between 1980 and 2012, the number of...Ch. 2.3 - Ideal Family Size The following USA Today-type...Ch. 2.3 - National League Baseball MVP The following pie...Ch. 2.3 - Prob. 16AYUCh. 2 - Effective Commercial Harris Interactive conducted...Ch. 2 - Weapons Used in Homicide The following frequency...Ch. 2 - Live Births The following frequency distribution...Ch. 2 - Political Affiliation One hundred randomly...Ch. 2 - Family Size A random sample of 60 couples married...Ch. 2 - Home Ownership Rates The table shows the home...Ch. 2 - Diameter of a Cookie The following data represent...Ch. 2 - Time Online The following data represent the...Ch. 2 - Grade Inflation The side-by-side bar graph to the...Ch. 2 - Income Distribution The following data represent...Ch. 2 - Misleading Graphs In 2013, the average earnings of...Ch. 2 - High Heels The graphic to the right is a USA Today...Ch. 2 - The graph shows the ratings on Yelp for Hot Dougs...Ch. 2 - A random sample of 1005 adult Americans was asked,...Ch. 2 - Interested in knowing the educational background...Ch. 2 - The following data represent the number of cars...Ch. 2 - Dr. Paul Oswiecmiski randomly selects 40 of his...Ch. 2 - The following data represent the time (in minutes)...Ch. 2 - The data below shows birth rate and per capita...Ch. 2 - The following is a USA Today-type graph. Do you...Ch. 2 - A bar graph or pie chart (or both) that depicts...Ch. 2 - A histogram that displays the distribution of...Ch. 2 - Six histograms displaying tornado duration for...Ch. 2 - A bar chart that shows the relationship between...Ch. 2 - A bar chart that shows the relationship between...Ch. 2 - A general summary of your findings and...
Knowledge Booster


Learn more about
Need a deep-dive on the concept behind this application? Look no further. Learn more about this topic, statistics and related others by exploring similar questions and additional content below.Similar questions
- 38. Possible values of X, the number of components in a system submitted for repair that must be replaced, are 1, 2, 3, and 4 with corresponding probabilities .15, .35, .35, and .15, respectively. a. Calculate E(X) and then E(5 - X).b. Would the repair facility be better off charging a flat fee of $75 or else the amount $[150/(5 - X)]? [Note: It is not generally true that E(c/Y) = c/E(Y).]arrow_forward74. The proportions of blood phenotypes in the U.S. popula- tion are as follows:A B AB O .40 .11 .04 .45 Assuming that the phenotypes of two randomly selected individuals are independent of one another, what is the probability that both phenotypes are O? What is the probability that the phenotypes of two randomly selected individuals match?arrow_forward53. A certain shop repairs both audio and video compo- nents. Let A denote the event that the next component brought in for repair is an audio component, and let B be the event that the next component is a compact disc player (so the event B is contained in A). Suppose that P(A) = .6 and P(B) = .05. What is P(BA)?arrow_forward
- 26. A certain system can experience three different types of defects. Let A;(i = 1,2,3) denote the event that the sys- tem has a defect of type i. Suppose thatP(A1) = .12 P(A) = .07 P(A) = .05P(A, U A2) = .13P(A, U A3) = .14P(A2 U A3) = .10P(A, A2 A3) = .011Rshelfa. What is the probability that the system does not havea type 1 defect?b. What is the probability that the system has both type 1 and type 2 defects?c. What is the probability that the system has both type 1 and type 2 defects but not a type 3 defect? d. What is the probability that the system has at most two of these defects?arrow_forwardThe following are suggested designs for group sequential studies. Using PROCSEQDESIGN, provide the following for the design O’Brien Fleming and Pocock.• The critical boundary values for each analysis of the data• The expected sample sizes at each interim analysisAssume the standardized Z score method for calculating boundaries.Investigators are evaluating the success rate of a novel drug for treating a certain type ofbacterial wound infection. Since no existing treatment exists, they have planned a one-armstudy. They wish to test whether the success rate of the drug is better than 50%, whichthey have defined as the null success rate. Preliminary testing has estimated the successrate of the drug at 55%. The investigators are eager to get the drug into production andwould like to plan for 9 interim analyses (10 analyzes in total) of the data. Assume thesignificance level is 5% and power is 90%.Besides, draw a combined boundary plot (OBF, POC, and HP)arrow_forwardPlease provide the solution for the attached image in detailed.arrow_forward
- 20 km, because GISS Worksheet 10 Jesse runs a small business selling and delivering mealie meal to the spaza shops. He charges a fixed rate of R80, 00 for delivery and then R15, 50 for each packet of mealle meal he delivers. The table below helps him to calculate what to charge his customers. 10 20 30 40 50 Packets of mealie meal (m) Total costs in Rands 80 235 390 545 700 855 (c) 10.1. Define the following terms: 10.1.1. Independent Variables 10.1.2. Dependent Variables 10.2. 10.3. 10.4. 10.5. Determine the independent and dependent variables. Are the variables in this scenario discrete or continuous values? Explain What shape do you expect the graph to be? Why? Draw a graph on the graph provided to represent the information in the table above. TOTAL COST OF PACKETS OF MEALIE MEAL 900 800 700 600 COST (R) 500 400 300 200 100 0 10 20 30 40 60 NUMBER OF PACKETS OF MEALIE MEALarrow_forwardLet X be a random variable with support SX = {−3, 0.5, 3, −2.5, 3.5}. Part ofits probability mass function (PMF) is given bypX(−3) = 0.15, pX(−2.5) = 0.3, pX(3) = 0.2, pX(3.5) = 0.15.(a) Find pX(0.5).(b) Find the cumulative distribution function (CDF), FX(x), of X.1(c) Sketch the graph of FX(x).arrow_forwardA well-known company predominantly makes flat pack furniture for students. Variability with the automated machinery means the wood components are cut with a standard deviation in length of 0.45 mm. After they are cut the components are measured. If their length is more than 1.2 mm from the required length, the components are rejected. a) Calculate the percentage of components that get rejected. b) In a manufacturing run of 1000 units, how many are expected to be rejected? c) The company wishes to install more accurate equipment in order to reduce the rejection rate by one-half, using the same ±1.2mm rejection criterion. Calculate the maximum acceptable standard deviation of the new process.arrow_forward
- 5. Let X and Y be independent random variables and let the superscripts denote symmetrization (recall Sect. 3.6). Show that (X + Y) X+ys.arrow_forward8. Suppose that the moments of the random variable X are constant, that is, suppose that EX" =c for all n ≥ 1, for some constant c. Find the distribution of X.arrow_forward9. The concentration function of a random variable X is defined as Qx(h) = sup P(x ≤ X ≤x+h), h>0. Show that, if X and Y are independent random variables, then Qx+y (h) min{Qx(h). Qr (h)).arrow_forward
arrow_back_ios
SEE MORE QUESTIONS
arrow_forward_ios
Recommended textbooks for you
 Holt Mcdougal Larson Pre-algebra: Student Edition...AlgebraISBN:9780547587776Author:HOLT MCDOUGALPublisher:HOLT MCDOUGAL
 Glencoe Algebra 1, Student Edition, 9780079039897...AlgebraISBN:9780079039897Author:CarterPublisher:McGraw Hill
 Big Ideas Math A Bridge To Success Algebra 1: Stu...AlgebraISBN:9781680331141Author:HOUGHTON MIFFLIN HARCOURTPublisher:Houghton Mifflin Harcourt
 Algebra & Trigonometry with Analytic GeometryAlgebraISBN:9781133382119Author:SwokowskiPublisher:Cengage
 Functions and Change: A Modeling Approach to Coll...AlgebraISBN:9781337111348Author:Bruce Crauder, Benny Evans, Alan NoellPublisher:Cengage Learning
Holt Mcdougal Larson Pre-algebra: Student Edition...
Algebra
ISBN:9780547587776
Author:HOLT MCDOUGAL
Publisher:HOLT MCDOUGAL
Glencoe Algebra 1, Student Edition, 9780079039897...
Algebra
ISBN:9780079039897
Author:Carter
Publisher:McGraw Hill
Big Ideas Math A Bridge To Success Algebra 1: Stu...
Algebra
ISBN:9781680331141
Author:HOUGHTON MIFFLIN HARCOURT
Publisher:Houghton Mifflin Harcourt
Algebra & Trigonometry with Analytic Geometry
Algebra
ISBN:9781133382119
Author:Swokowski
Publisher:Cengage
Functions and Change: A Modeling Approach to Coll...
Algebra
ISBN:9781337111348
Author:Bruce Crauder, Benny Evans, Alan Noell
Publisher:Cengage Learning
what is Research Design, Research Design Types, and Research Design Methods; Author: Educational Hub;https://www.youtube.com/watch?v=LpmGSioXxdo;License: Standard YouTube License, CC-BY