
Concept explainers
Videos
a.
To Justify:
The use of a linear function to model the given data set.
The use of a linear function is justified as the data points are clustered near a straight line in the
Given:
The data set:
| Year | Fuel Economy (mpg) |
| 1995 | 21.1 |
| 2000 | 21.9 |
| 2005 | 22.1 |
| 2010 | 23.3 |
| 2015 | 23.2 |
Assume
Concepts Used:
Drawing of Scatter Plot from data points.
Calculating a linear model that fits the data using a graphing calculator.
Calculations:
Draw a scatter plot of the given data. And fit a regression line on it using a graphing calculator.
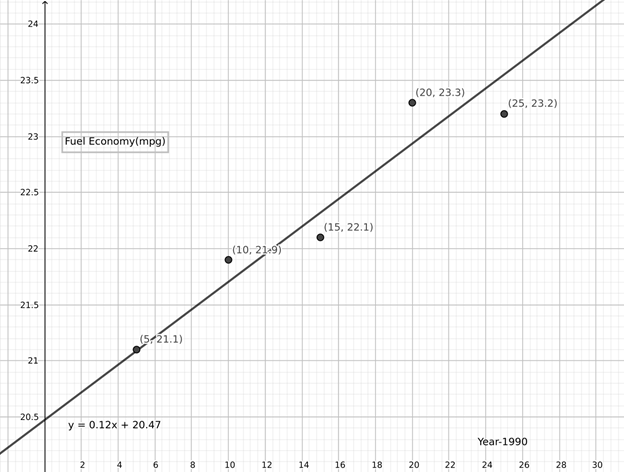 It can be seen that the data points are clustered close to a line.
Conclusion:
Thus the use of a linear model is justified.
b.
To Determine:
A linear regression model for the given data set.
To State:
The meaning of the slope in the regression model.
The slope
Given:
The data set:
| Year | Fuel Economy (mpg) |
| 1995 | 21.1 |
| 2000 | 21.9 |
| 2005 | 22.1 |
| 2010 | 23.3 |
| 2015 | 23.2 |
Assume
Concepts Used:
Drawing of Scatter Plot from data points.
Calculating a linear model that fits the data using a graphing calculator.
The slope
Calculations:
Draw a scatter plot of the given data. And fit a regression line on it using a graphing calculator.

It can be seen that the regression line is
Conclusion:
The regression line is
The slope
c.
To Determine:
The fuel economy in the year
The fuel economy in the year
mpg.
Given:
The data set:
| Year | Fuel Economy (mpg) |
| 1995 | 21.1 |
| 2000 | 21.9 |
| 2005 | 22.1 |
| 2010 | 23.3 |
| 2015 | 23.2 |
Assume
Known from previous part:
The regression line is
Concepts Used:
Predicting the value of a variable using a linear regression model.
Substitution of a variable.
Calculations:
The year
Substitute
Conclusion:
The fuel economy in the year
mpg.
Chapter 2 Solutions
PRECALCULUS:GRAPH...-NASTA ED.(FLORIDA)


- Pls help ASAParrow_forward9. a) Determie values of a and b so that the function is continuous. ax - 2b f(x) 2 x≤-2 -2x+a, x ≥2 \-ax² - bx + 1, −2 < x < 2) 9b) Consider f(x): = 2x²+x-3 x-b and determine all the values of b such that f(x) does not have a vertical asymptote. Show work.arrow_forwardPls help ASAParrow_forward
- 3. True False. If false create functions that prove it is false. Note: f(x) = g(x). a) If_lim ƒ(x) = ∞ and_lim g(x) = ∞,then_lim [ƒ(x) − g(x)] = 0 x→ 0+ x→0+ x→0+ b) If h(x) and g(x) are continuous at x = c, and if h(c) > 0 and g(c) = 0, then h(x) lim. will = x→c g(x) c) If lim f(x) = 0 and lim g(x) = 0 then lim f(x) does not exist. x-a x-a x→a g(x)arrow_forwardPls help ASAParrow_forward15. a) Consider f(x) = x-1 3x+2 and use the difference quotient to determine the simplified expression in terms of x, for the slope of any tangent to y = f(x). Also, determine the slope at x = 2. 15 b) Determine the equation of the tangent to f(x) at x = 2. Final answer in Standard Form Ax + By + C = 0, A ≥ 0, with no fractions or decimals.arrow_forward
 Calculus: Early TranscendentalsCalculusISBN:9781285741550Author:James StewartPublisher:Cengage Learning
 Thomas' Calculus (14th Edition)CalculusISBN:9780134438986Author:Joel R. Hass, Christopher E. Heil, Maurice D. WeirPublisher:PEARSON
 Calculus: Early Transcendentals (3rd Edition)CalculusISBN:9780134763644Author:William L. Briggs, Lyle Cochran, Bernard Gillett, Eric SchulzPublisher:PEARSON
 Calculus: Early TranscendentalsCalculusISBN:9781319050740Author:Jon Rogawski, Colin Adams, Robert FranzosaPublisher:W. H. Freeman
 Calculus: Early Transcendental FunctionsCalculusISBN:9781337552516Author:Ron Larson, Bruce H. EdwardsPublisher:Cengage Learning