Sub part (a):
The Gini ratio.
Sub part (a):
Explanation of Solution
Figure 1 illustrates the Lorenz curve.
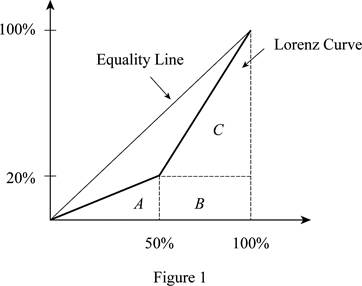
In Figure 1, the horizontal axis measures the percentage of population and the vertical axis measures the percentage of income. In this, we find the area under the Lorenz curve. Thus, the area of triangle can be calculated as follows:
Thus, the area of triangle is 500.
The base of the triangle is 50 (at 50%) because there are only two people in the economy. The height of the triangle is 20 (at 20%) because the lowest income is $20,000, which is 20% of the total income earned in society (= ($20,000 / $100,000) x 100).
The area of the rectangle of B can be calculated as follows:
Thus, the area of the rectangle B value is 1,000.
The area of the rectangle of C can be calculated as follows:
The area of triangle C is 2,000.
The total area under the Lorenz curve can be calculated as follows:
The total area value is 3,500.
The Gini ratio can be calculated as follows:
Thus, the Gini ratio is 0.300.
Concept introduction:
Gini ratio: It is a measure of statistical scattering that is intended to represent the income distribution of a nation's residents and is most commonly used to measure inequality.
Lorenz curve: It is the graphical illustration of the income distribution or of the wealth.
Sub Part (b):
The Gini ratio in the scenario 2.
Sub Part (b):
Explanation of Solution
After the tax and redistribution program Larry's new income is $40,000 and Roger's new income is $60,000. This implies that Larry (50% of the population) now controls 40% of the society's income rather than the 20% before the program.
The area of the triangle A can be calculated as follows:
The value of the triangle area is 1,000.
The value of rectangle B can be calculated as follows:
The area of rectangle B is 2,000.
The area of rectangle C can be calculated as follows:
The area of triangle C can be calculated as follows:
The total area under the Lorenz curve can be calculated as follows:
The total area value is 4,500.
The Gini ratio can be calculated as follows:
Thus the Gini ratio here is 0.100.
Concept introduction:
Gini ratio: It is a measure of statistical scattering that is intended to represent the income distribution of a nation's residents and is most commonly used to measure inequality.
Lorenz curve: It is the graphical illustration of the income distribution or of the wealth.
Sub part (c):
Change in the Gini ratio with change in income.
Sub part (c):
Explanation of Solution
If the income is double, Larry will earn $40,000 and Roger will earn $160,000. The total income in society is now $200,000. Larry still only controls 20% of the society's income ((=$40,000/$200,000) x 100).
Since the doubling of income does not change the percentage of income that is controlled by Larry (or Roger) , the Gini ratio will not change. Thus, the answer will be the same as in part 'a' at 0.300. Thus, the Gini ratio remains the same as it was before and after the income doubles.
Want to see more full solutions like this?
Chapter 21 Solutions
Economics: Principles, Problems, & Policies (McGraw-Hill Series in Economics) - Standalone book

- Identify the two curves shown on the graph, and explain their upward and downward slopes. Why does curve Aintersect the horizontal axis? What is the significance of quantity d? What does erepresent? How would the optimal quantity of information change if the marginal benefit of information increased—that is, if the marginal benefit curve shifted upward?arrow_forward6. Rent seeking The following graph shows the demand, marginal revenue, and marginal cost curves for a single-price monopolist that produces a drug that helps relieve arthritis pain. Place the grey point (star symbol) in the appropriate location on the graph to indicate the monopoly outcome such that the dashed lines reveal the profit-maximizing price and quantity of a single-price monopolist. Then, use the green rectangle (triangle symbols) to show the profits earned by the monopolist. 18 200 20 16 16 14 PRICE (Dollars per dose) 12 10 10 8 4 2 MC = ATC MR Demand 0 0 5 10 15 20 25 30 35 40 45 50 QUANTITY (Millions of doses per year) Monopoly Outcome Monopoly Profits Suppose that should the patent on this particular drug expire, the market would become perfectly competitive, with new firms immediately entering the market with essentially identical products. Further suppose that in this case the original firm will hire lobbyists and make donations to several key politicians to extend its…arrow_forwardConsider a call option on a stock that does not pay dividends. The stock price is $100 per share, and the risk-free interest rate is 10%. The call strike is $100 (at the money). The stock moves randomly with u=2 and d=0.5. 1. Write the system of equations to replicate the option using A shares and B bonds. 2. Solve the system of equations and determine the number of shares and the number of bonds needed to replicate the option. Show your answer with 4 decimal places (x.xxxx); do not round intermediate calculations. This is easy to do in Excel. A = B = 3. Use A shares and B bonds from the prior question to calculate the premium on the option. Again, do not round intermediate calculations and show your answer with 4 decimal places. Call premium =arrow_forward
- Answer these questions using replication or the risk neutral probability. Both methods will produce the same answer. Show your work to receive credit. 6. What is the premium of a call with a higher strike. Show your work to receive credit; do not round intermediate calculations. S0 = $100, u=2, d=0.5, r=10%, strike=$150arrow_forwardAnswer these questions using replication or the risk neutral probability. Both methods will produce the same answer.arrow_forwardProblem 2: At a raffle, 2000 tickets are sold at $5 each for five prizes of $2000, $1000, $500, $250, and $100. You buy one ticket. What is the expected value of your gain? 1. Find the gain for each prize. 2. Write a probability distribution for the possible gains. 3. Find the expected value. 4. Interpret the results.arrow_forward
- This activity focuses on developing direct and supported opinions using various sources of information on the importance of the following topics: non-renewable and renewable energies, economic factors and obstacles that can affect the relationship between international trade and economic growth, devaluation of the currency in countries, and the imbalance of economic equity. In this context, it is essential that, when studying and developing these topics, students understand the concepts of the value of currencies and that leads to devaluation, non-renewable and renewable energy resources, economic development and obstacles, distribution of wealth, economic growth and external and internal constraints, and about international trade as a growth factor. Thus, the objectives that are intended to be achieved are the following: Acquire knowledge about the concepts mentioned above. Determine relationships between economic growth and international trade. Understand what some limitations that…arrow_forwardConsider a firm facing conventional production technology. The short run Production Function has a small range of increasing marginal product (increasing marginal returns) and then is subject to the Law of Diminishing Marginal Product (diminishing marginal returns). A. Putting quantity on the horizontal axis and dollars on the vertical axis, depict three important curves: Fixed Cost (FC), Variable Cost (VC), and Total Cost (TC). (Note that we are not asking you to depict average cost functions!) B. Please clearly indicate on this graph the range of quantities where the firm is experiencing (1) increasing marginal product and (2) diminishing marginal product. C. In a few sentences, please justify why you've made this specific classification of increasing/diminishing marginal product in part (b).arrow_forwardplease answer the following questions: What is money, and why does anyone want it? Explain the concept of the opportunity cost of holding money . Explain why an increase in U.S. interest rates relative to UK interest rates would affect the U.S.-UK exchange rate. Suppose that a person’s wealth is $50,000 and that her yearlyincome is $60,000. Also suppose that her money demand functionis given by Md = $Y10.35 - i2Derive the demand for bonds. Suppose the interest rate increases by 10 percentage points. What is the effect on her demand for bonds?b. What are the effects of an increase in income on her demand for money and her demand for bonds? Explain in wordsarrow_forward
- Driving Quiz X My Course G city place w x D2L Login - Univ X D2L Login - Univ x D2L Login - U acmillanlearning.com/ihub/assessment/f188d950-dd73-11e0-9572-0800200c9a66/4db68a5e-69bb-4767-8d6c-a12d +1687 pts /1800 © Macmillan Learning Question 6 of 18 > The graph shows the average total cost (ATC) curve, the marginal cost (MC) curve, the average variable cost (AVC) curve, and the marginal revenue (MR) curve (which is also the market price) for a perfectly competitive firm that produces terrible towels. Answer the three questions, assuming that the firm is profit-maximizing and does not shut down in the short run. What is the firm's total revenue? S What is the firm's total cost? $ What is the firm's profit? (Enter a negative number for a loss.) $ Price $320 $300 $200 $150 205 260 336 365 Quantity MC ATC AVC MR=Parrow_forward1. Suppose that the two nations face the following benefits of pollution, B, and costs of abatement, C: BN = 10, Bs = 7; CN = 5, Cs = 4. Further assume that if the nation chooses to abate pollution, it still receives the benefits of pollution but now must pay the cost of abatement as well. a. Identify the payoffs that accrue to each nation under the four different possible outcomes of the game and present these payoffs in the normal form of the game. b. Recall that the term dominant strategy defines the condition that a player in a game would prefer to play that strategy (in this case either pollute or abate) regardless of the strategy chosen by the other player in the game. Does either nation have a dominant strategy in this game? If so, what is it? c. Identify the Nash equilibria, or non-cooperative equilibria, of this game.arrow_forwardagrody calming Inted 001 and me 2. A homeowner is concerned about the various air pollutants (e.g., benzene and methane) released in her house when she cooks with natural gas. She is considering replacing her gas oven and stove with an electric stove comprising an induction cooktop and convection oven. The new appliance costs $900 to purchase and install. Capping the old gas line costs an additional $150 (a one-time fee). The old line must be inspected for leaks each year after capping, at a cost of $35 for each inspection. a. If the homeowner plans to remain in the house for four more years and the discount rate is 4%, what is the minimum present value of the benefits that the homeowner would need to experience for this purchase to be justified based on its private net sub present value? b. While trying to understand how she might express the value of reduced exposure to indoor air pollutants in dollar terms, the homeowner consulted the EPA website and found estimates provided by…arrow_forward
 Principles of Economics (MindTap Course List)EconomicsISBN:9781305585126Author:N. Gregory MankiwPublisher:Cengage Learning
 Principles of Microeconomics (MindTap Course List)EconomicsISBN:9781305971493Author:N. Gregory MankiwPublisher:Cengage Learning
 Principles of Economics, 7th Edition (MindTap Cou...EconomicsISBN:9781285165875Author:N. Gregory MankiwPublisher:Cengage Learning
 Principles of MicroeconomicsEconomicsISBN:9781305156050Author:N. Gregory MankiwPublisher:Cengage Learning
 Microeconomics: Private and Public Choice (MindTa...EconomicsISBN:9781305506893Author:James D. Gwartney, Richard L. Stroup, Russell S. Sobel, David A. MacphersonPublisher:Cengage Learning
 Economics: Private and Public Choice (MindTap Cou...EconomicsISBN:9781305506725Author:James D. Gwartney, Richard L. Stroup, Russell S. Sobel, David A. MacphersonPublisher:Cengage Learning