Total income, net taxes and
Explanation of Solution
Figure 1 represents the circular flow of income in the economy. The information provided in the given case indicates that government expenditure in the economy, shown by 'U' in Figure 1, is $2 trillion. The variable 'W' that reflects consumption expenditure in the economy, is worth $7 trillion.
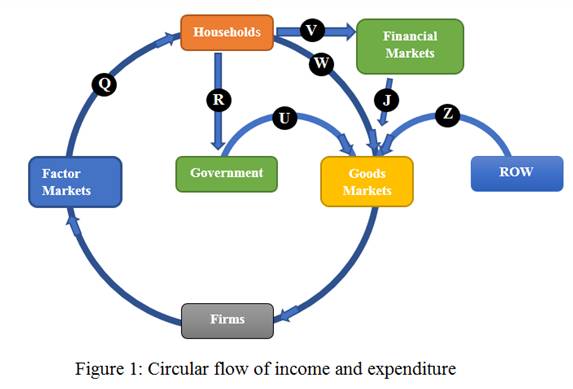
In the similar manner, the flow shown by variable 'J' is the investment expenditure and 'Z' shows the flow of net exports. These expenditures are equal to $1.5 trillion and $0 respectively.
In an economy, the total income is the factor income earned by the factors o9f production. Here, the factor market is paying an income shown by 'Q' in Figure 1. This value is not provided. Hence, use the
Under expenditure method, GDP is computed as the sum of four expenditures:

Here 'C' is the consumption spending, 'I' is the investment spending, 'G' is the spending incurred by the government and 'NX' is the net exports. Data indicates that the value of 'C' is $7 trillion, and that of 'I' is $1.5 trillion. Net exports are worth $0 and 'G' is $2 trillion.
Use the expenditure method to find GDP as well as total income:


Total income as well as GDP is both worth.  trillionNet taxes represent the amount of taxes paid by the household that are subjected to all the cash benefits received by them. In figure 1, this is represented by a flow of variable 'R'. Note that there is no value provide for net taxes. Hence, use the following expression for net taxes:

In this case, 'S' is the saving and is shown by 'V' in figure 1.
The value of 'V' is $1.5 trillion so that saving is $1.5 trillion. Given that 'C' is $7 trillion and 'Y' is found to be $10.5 trillion. Use these values to find net taxes:


Hence, net taxes are worth$2 trillion.
Concept Introduction:
Circular flow of income is a tool that is used to represents the flow of real and monetary variables among various sectors in the economy. The nation has four major market participants in the form of firms, households, financial institutions and the government. The flow of goods and services is in the opposite direction to the flow of money.
Want to see more full solutions like this?
Chapter 21 Solutions
Foundations of Economics, Student Value Edition Plus MyLab Economics with eText -- Access Card Package (8th Edition)

- 1. The IS/MP model assumes that the Fed sets the real interest rate at a given level Rt. Suppose the Fed adopts a monetary policy rule that instructs it how to change the real interest rate in response to short-run output. Let's call this a monetary policy rule (MPR): The parameter x is positive. Rt=+xY a) Redraw the IS/MP diagram replacing the MP curve with the MPR curve. Show how an aggregate demand shock affects output and interest rates in the short run. Use the IS and MPR equations to solve for the changes in output and the real interest rate. b) How does the change in a affect investment in the IS/MPR model? Explain how a tax cut affects short-run output and investment in this version of the short-run model. The effect on investment is called crowding out. c) Add the Phillips curve to complete the short-run model. Illustrate how the Fed's choice of large it makes reveals its trade off between inflation and output in the short run.arrow_forwardnot use ai pleasearrow_forwardFems A and B are duopolist producers of widgets. The cost function for producing widgets C(Q)-Q² The market demand function for widgets i Q-192P Qmeasures thousands of widgets per year, Competition in the widget market is described by the Coumot model Instructions: Round your answers to 2 decimal places a What are the firms' Nanh equbrium output? b. What is the resulting price? c. What do they each emp How does the price compare to marginal cost? Price is ck to marginal cost How do the price and the two fems' joint profit compare to the monopoly price and prof Compared to the monopoly price, the Cournot price is to sed. Compared to the monopoly profit, the joint profit of the two fems to selectarrow_forward
- Suppose the marginal social cost of television sets is $100. This is constant and equal to the average cost of television sets. The annual demand for television sets is given by the following equation: Q = 200,000-500P, where Qis the quantity sold per year and P is the price of television sets. a) If television sets are sold in a perfectly competitive market, calculate the annual number sold. Under what circumstances will the market equilibrium be efficient? b) Show the losses in well-being each year that would result from a law limiting sales of television sets to 100,000 per year. Show the effect on the price, marginal social benefit, and marginal social cost of television sets. Show the net loss in well-being that will result from a complete ban on the sales of television sets. (show with graphs.)arrow_forwardrefer to exhibit 8.12 and identify each curve in the grapharrow_forwardQ1. (Chap 1: Game Theory.) In the simultaneous games below player 1 is choosing between Top and Bottom, while player 2 is choosing between Left and Right. In each cell the first number is the payoff to player 1 and the second is the payoff to player 2. Part A: Player 1 Top Bottom Player 2 Left 25, 22 Right 27,23 26,21 28, 22 (A1) Does player 1 have a dominant strategy? (Yes/No) If your answer is yes, which one is it? (Top/Bottom) (A2) Does player 2 have a dominant strategy? (Yes/No.) If your answer is yes, which one is it? (Left/Right.) (A3) Can you solve this game by using the dominant strategy method? (Yes/No) If your answer is yes, what is the solution?arrow_forward
- not use ai pleasearrow_forwardsubject to X1 X2 Maximize dollars of interest earned = 0.07X1+0.11X2+0.19X3+0.15X4 ≤ 1,000,000 <2,500,000 X3 ≤ 1,500,000 X4 ≤ 1,800,000 X3 + XA ≥ 0.55 (X1+X2+X3+X4) X1 ≥ 0.15 (X1+X2+X3+X4) X1 + X2 X3 + XA < 5,000,000 X1, X2, X3, X4 ≥ 0arrow_forwardnot use aiarrow_forward
- Please help and Solve! (Note: this is a practice problem)arrow_forwardPlease help and thanks! (Note: This is a practice problem!)arrow_forwardUnit VI Assignment Instructions: This assignment has two parts. Answer the questions using the charts. Part 1: Firm 1 High Price Low Price High Price 8,8 0,10 Firm 2 Low Price 10,0 3,3 Question: For the above game, identify the Nash Equilibrium. Does Firm 1 have a dominant strategy? If so, what is it? Does Firm 2 have a dominant strategy? If so, what is it? Your response:arrow_forward


 Essentials of Economics (MindTap Course List)EconomicsISBN:9781337091992Author:N. Gregory MankiwPublisher:Cengage Learning
 Brief Principles of Macroeconomics (MindTap Cours...EconomicsISBN:9781337091985Author:N. Gregory MankiwPublisher:Cengage Learning
 Economics Today and Tomorrow, Student EditionEconomicsISBN:9780078747663Author:McGraw-HillPublisher:Glencoe/McGraw-Hill School Pub Co