
Concept explainers
Videos
Warren Lloyd is interested in leasing a new car and has contacted three automobile dealers for pricing information. Each dealer offered Warren a closed-end 36-month lease with no down payment due at the time of signing. Each lease includes a monthly charge and a mileage allowance. Additional miles receive a surcharge on a per-mile basis. The monthly lease cost, the mileage allowance, and the cost for additional miles follow:
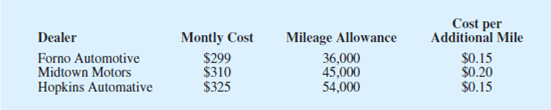
Warren decided to choose the lease option that will minimize his total 36-month cost. The difficulty is that Warren is not sure how many miles he will drive over the next three years. For purposes of this decision he believes it is reasonable to assume that he will drive 12,000 miles per year, 15,000 miles per year, or 18,000 miles per year. With this assumption Warren estimated his total costs for the three lease options. For example, he figures that the Forno Automotive lease will cost him $10,764 if he drives 12,000 miles per year, $12,114 if he drives 15,000 miles per year, or $13,464 if he drives 18,000 miles per year.
- a. What is the decision, and what is the chance
event ? - b. Construct a payoff table.
- c. Suppose that the
probabilities that Warren drives 12,000, 15,000, and 18,000 miles per year are 0.5, 0.4, and 0.1, respectively. What dealer should Warren choose? - d. Suppose that after further consideration, Warren concludes that the probabilities that he will drive 12,000, 15,000 and 18,000 miles per year are 0.3, 0.4, and 0.3, respectively. What dealer should Warren select?

Trending nowThis is a popular solution!

Chapter 21 Solutions
STATISTICS F/BUSINESS+ECONOMICS-TEXT


- A company found that the daily sales revenue of its flagship product follows a normal distribution with a mean of $4500 and a standard deviation of $450. The company defines a "high-sales day" that is, any day with sales exceeding $4800. please provide a step by step on how to get the answers in excel Q: What percentage of days can the company expect to have "high-sales days" or sales greater than $4800? Q: What is the sales revenue threshold for the bottom 10% of days? (please note that 10% refers to the probability/area under bell curve towards the lower tail of bell curve) Provide answers in the yellow cellsarrow_forwardFind the critical value for a left-tailed test using the F distribution with a 0.025, degrees of freedom in the numerator=12, and degrees of freedom in the denominator = 50. A portion of the table of critical values of the F-distribution is provided. Click the icon to view the partial table of critical values of the F-distribution. What is the critical value? (Round to two decimal places as needed.)arrow_forwardA retail store manager claims that the average daily sales of the store are $1,500. You aim to test whether the actual average daily sales differ significantly from this claimed value. You can provide your answer by inserting a text box and the answer must include: Null hypothesis, Alternative hypothesis, Show answer (output table/summary table), and Conclusion based on the P value. Showing the calculation is a must. If calculation is missing,so please provide a step by step on the answers Numerical answers in the yellow cellsarrow_forward
 Holt Mcdougal Larson Pre-algebra: Student Edition...AlgebraISBN:9780547587776Author:HOLT MCDOUGALPublisher:HOLT MCDOUGAL
 Elementary AlgebraAlgebraISBN:9780998625713Author:Lynn Marecek, MaryAnne Anthony-SmithPublisher:OpenStax - Rice University
 Algebra: Structure And Method, Book 1AlgebraISBN:9780395977224Author:Richard G. Brown, Mary P. Dolciani, Robert H. Sorgenfrey, William L. ColePublisher:McDougal Littell
 Mathematics For Machine TechnologyAdvanced MathISBN:9781337798310Author:Peterson, John.Publisher:Cengage Learning,
 Elementary Geometry For College Students, 7eGeometryISBN:9781337614085Author:Alexander, Daniel C.; Koeberlein, Geralyn M.Publisher:Cengage,