
Concept explainers
Videos
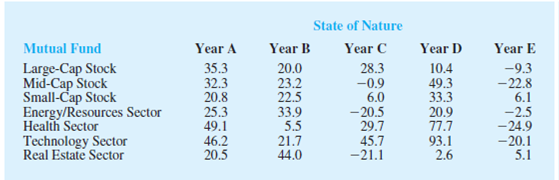
An investor wants to select one of seven mutual funds for the coming year. Data showing the percentage annual return for each fund during five typical one-year periods are shown here. The assumption is that one of these five-year periods will occur again during the coming year. Thus, years A, B, C, D, and E are the states of nature for the mutual fund decision.
- a. Suppose that an experienced financial analyst reviews the five states of nature and provides the following probabilities: .1, .3, .1, .1, and .4. Using the
expected value approach, what is the recommended mutual fund? What is the expected annual return? Using this mutual fund, what are the minimum and maximum annual returns? - b. A conservative investor notes that the Small-Cap mutual fund is the only fund that does not have the possibility of a loss. In fact, if the Small-Cap fund is chosen, the investor is guranteed a return of at least 6%. What is the expected annual return for this fund?
- c. Considering the mutual funds recommended in parts (a) and (b), which fund appears to have more risk? Why? Is the expected annual return greater for the mutual fund with more risk?
- d. What mutual fund would you recommend to the investor? Explain.
a.
Identify the recommended mutual fund. And compute the expected annual return.
Compute the minimum and maximum annual return Based on the recommended mutual fund.
Answer to Problem 18SE
The technology sector is the recommended mutual fund with expected annual return is 16.97%.
The minimum annual return for the technology sector is –20.1% and maximum annual return for the technology sector is 93.1%.
Explanation of Solution
Calculation:
There are a total of seven mutual funds. The table provides percentage annual return for each fund during five typical one-year periods. There are 5 states of nature for the mutual funds. The probabilities for states of nature are 0.1, 0.3, 0.1, 0.1, and 0.4 respectively.
Expected value approach:
The expected value (EV) of a decision rule
Where,
Since the problem deals with profit, the optimal decision is one with maximum expected value (EV).
The expected value for the Large-Cap Stock mutual fund is as follows:
Substitute the following values in the expected value approach,
Therefore,
The expected value Large-Cap Stock mutual fund is 9.68%.
Similarly the other expected values are obtained as shown in the table:
| Mutual Fund | Expected Annual Return |
| Large-Cap Stock | 9.68 |
| Mid-Cap Stock | |
| Small-Cap Stock | |
| Emergency/Resource Sector | |
| Health Sector | |
| Technology Sector | |
| Real Estate Sector |
From the expected values, it is clear that the technology sector provide maximum expected value. The annual return of technology sector is 16.97%.
From the table of percentage annual return, the minimum annual return for the technology sector is –20.1% and maximum annual return for the technology sector is 93.1%.
b.
Compute the expected annual return for Small-Cap Stock.
Answer to Problem 18SE
The expected annual return for Small-Cap Stock is 15.20%.
Explanation of Solution
The investor note that the Small-Cap mutual funds are mutual funds that does not have a chance of loss. The Small-Cap mutual funds guaranteed a return of at least 6%.
From part (a), it is clear that expected annual return for Small-Cap Stock is 15.20%. But the recommended mutual fund is technology sector with expected value 16.97%. The difference between recommended and Small-Cap Stock is 1.77%
Therefore, the expected annual return for Small-Cap Stock is 15.20%.
c.
Identify the mutual fund that explained in parts (a) and (b) is more risky. Explain the reason.
Check whether annual return greater for the mutual fund with more risk.
Answer to Problem 18SE
The technology sector is more risky. Annual return greater for the mutual fund with more risk.
Explanation of Solution
From the table of percentage annual return, the minimum annual return for the technology sector is –20.1% and maximum annual return for the technology sector is 93.1%. That is, the annual return for technology sector varies from –20.1% to 93.1%. The minimum annual return for the Small-Cap Stock is 6% and maximum annual return for the Small-Cap Stock is 33.3%. That is, the annual return for Small-Cap Stock varies from 6% to 33.3%. That is, the range of variation is high for technology sector. Therefore, technology sector is more risky. The technology sector also have a higher expected annual return but only by 1.77%. Hence Annual return greater for the mutual fund with more risk.
d.
Identify which mutual fund is recommended to the investor. Explain the reason.
Answer to Problem 18SE
The recommended mutual fund is Small-Cap Stock.
Explanation of Solution
The answer will vary. One of the possible answer is given below:
From part (c), it is clear that, risk associated with Small-Cap Stock mutual fund is less compared to technology sector. From part (b), the high risk technology sector only has a 1.77% higher expected annual return. Therefore, mutual fund that recommended to the investor is Small-Cap Stock mutual fund.
Want to see more full solutions like this?
Chapter 21 Solutions
STATISTICS F/BUSINESS+ECONOMICS-TEXT


- A company found that the daily sales revenue of its flagship product follows a normal distribution with a mean of $4500 and a standard deviation of $450. The company defines a "high-sales day" that is, any day with sales exceeding $4800. please provide a step by step on how to get the answers in excel Q: What percentage of days can the company expect to have "high-sales days" or sales greater than $4800? Q: What is the sales revenue threshold for the bottom 10% of days? (please note that 10% refers to the probability/area under bell curve towards the lower tail of bell curve) Provide answers in the yellow cellsarrow_forwardFind the critical value for a left-tailed test using the F distribution with a 0.025, degrees of freedom in the numerator=12, and degrees of freedom in the denominator = 50. A portion of the table of critical values of the F-distribution is provided. Click the icon to view the partial table of critical values of the F-distribution. What is the critical value? (Round to two decimal places as needed.)arrow_forwardA retail store manager claims that the average daily sales of the store are $1,500. You aim to test whether the actual average daily sales differ significantly from this claimed value. You can provide your answer by inserting a text box and the answer must include: Null hypothesis, Alternative hypothesis, Show answer (output table/summary table), and Conclusion based on the P value. Showing the calculation is a must. If calculation is missing,so please provide a step by step on the answers Numerical answers in the yellow cellsarrow_forward
 MATLAB: An Introduction with ApplicationsStatisticsISBN:9781119256830Author:Amos GilatPublisher:John Wiley & Sons Inc
 Probability and Statistics for Engineering and th...StatisticsISBN:9781305251809Author:Jay L. DevorePublisher:Cengage Learning
 Statistics for The Behavioral Sciences (MindTap C...StatisticsISBN:9781305504912Author:Frederick J Gravetter, Larry B. WallnauPublisher:Cengage Learning
 Elementary Statistics: Picturing the World (7th E...StatisticsISBN:9780134683416Author:Ron Larson, Betsy FarberPublisher:PEARSON
 The Basic Practice of StatisticsStatisticsISBN:9781319042578Author:David S. Moore, William I. Notz, Michael A. FlignerPublisher:W. H. Freeman
 Introduction to the Practice of StatisticsStatisticsISBN:9781319013387Author:David S. Moore, George P. McCabe, Bruce A. CraigPublisher:W. H. Freeman