Elementary Statistics Using The Ti-83/84 Plus Calculator
5th Edition
ISBN: 9780134686943
Author: Triola, Mario F., Iossi, Laura
Publisher: Pearson,
expand_more
expand_more
format_list_bulleted
Videos
Textbook Question
Chapter 2.1, Problem 17BSC
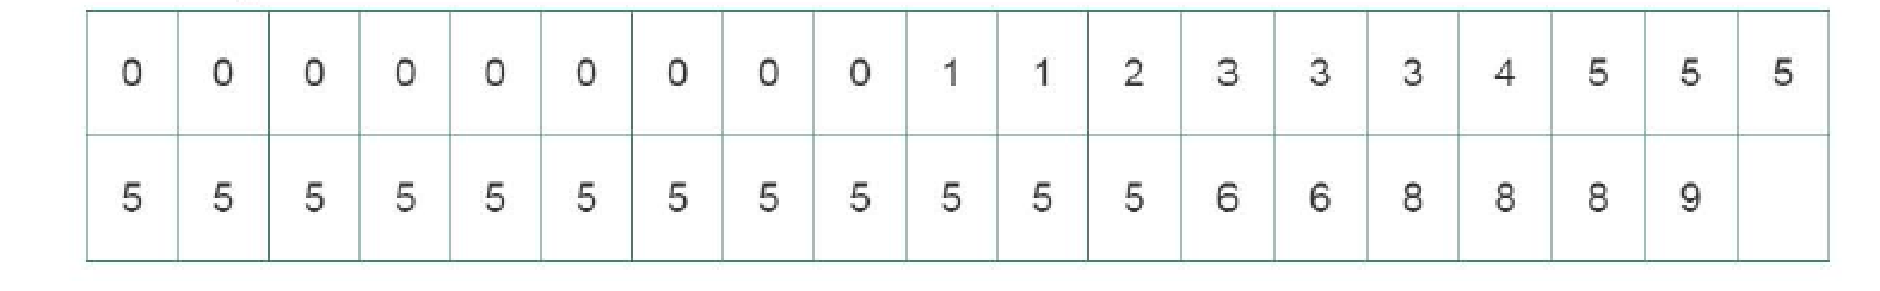
Constructing Frequency Distributions. In Exercises 11–18, use the indicated data to construct the frequency distribution. (The data for Exercises 13–16 can be downloaded at TriolaStats.com.)
17. Analysis of Last Digits Heights of statistics students were obtained by the author as part of an experiment conducted for class. The last digits of those heights are listed below. Construct a frequency distribution with 10 classes. Based on the distribution, do the heights appear to be reported or actually measured? What do you know about the accuracy of the results?
Expert Solution & Answer
Want to see the full answer?
Check out a sample textbook solution
Students have asked these similar questions
We consider a one-period market with the following properties: the current stock priceis S0 = 4. At time T = 1 year, the stock has either moved up to S1 = 8 (with probability0.7) or down towards S1 = 2 (with probability 0.3). We consider a call option on thisstock with maturity T = 1 and strike price K = 5. The interest rate on the money marketis 25% yearly.(a) Find the replicating portfolio (φ, ψ) corresponding to this call option.(b) Find the risk-neutral (no-arbitrage) price of this call option.(c) We now consider a put option with maturity T = 1 and strike price K = 3 onthe same market. Find the risk-neutral price of this put option. Reminder: A putoption gives you the right to sell the stock for the strike price K.1(d) An investor with initial capital X0 = 0 wants to invest on this market. He buysα shares of the stock (or sells them if α is negative) and buys β call options (orsells them is β is negative). He invests the cash balance on the money market (orborrows if the amount is…
Determine if the two statements are equivalent using a truth table
Question 4: Determine if pair of statements A and B are equivalent or not, using truth table.
A. (~qp)^~q
в. р л~9
Chapter 2 Solutions
Elementary Statistics Using The Ti-83/84 Plus Calculator
Ch. 2.1 - Prob. 1BSCCh. 2.1 - Prob. 2BSCCh. 2.1 - Prob. 3BSCCh. 2.1 - Prob. 4BSCCh. 2.1 - Prob. 5BSCCh. 2.1 - Prob. 6BSCCh. 2.1 - Prob. 7BSCCh. 2.1 - Prob. 8BSCCh. 2.1 - Prob. 9BSCCh. 2.1 - Prob. 10BSC
Ch. 2.1 - Prob. 11BSCCh. 2.1 - Prob. 12BSCCh. 2.1 - Prob. 13BSCCh. 2.1 - Prob. 14BSCCh. 2.1 - Prob. 15BSCCh. 2.1 - Constructing Frequency Distributions. In Exercises...Ch. 2.1 - Constructing Frequency Distributions. In Exercises...Ch. 2.1 - Prob. 18BSCCh. 2.1 - Prob. 19BSCCh. 2.1 - Relative Frequencies for Comparisons. In Exercises...Ch. 2.1 - Prob. 21BSCCh. 2.1 - Prob. 22BSCCh. 2.1 - Prob. 23BSCCh. 2.1 - Prob. 24BSCCh. 2.1 - Large Data Sets. Exercises 2528 involve large sets...Ch. 2.1 - Prob. 26BSCCh. 2.1 - Prob. 27BSCCh. 2.1 - Prob. 28BSCCh. 2.1 - Prob. 29BBCh. 2.2 - Prob. 1BSCCh. 2.2 - Prob. 2BSCCh. 2.2 - Blood Platelet Counts Listed below are blood...Ch. 2.2 - Prob. 4BSCCh. 2.2 - Interpreting a Histogram. In Exercises 5-8, answer...Ch. 2.2 - Prob. 6BSCCh. 2.2 - Prob. 7BSCCh. 2.2 - Prob. 8BSCCh. 2.2 - Prob. 9BSCCh. 2.2 - Constructing Histograms. In Exercises 916,...Ch. 2.2 - Constructing Histograms. In Exercises 916,...Ch. 2.2 - Constructing Histograms. In Exercises 916,...Ch. 2.2 - Prob. 13BSCCh. 2.2 - Prob. 14BSCCh. 2.2 - Prob. 15BSCCh. 2.2 - Prob. 16BSCCh. 2.2 - Prob. 17BBCh. 2.2 - Prob. 18BBCh. 2.3 - Prob. 1BSCCh. 2.3 - Prob. 2BSCCh. 2.3 - Prob. 3BSCCh. 2.3 - Prob. 4BSCCh. 2.3 - Prob. 9BSCCh. 2.3 - Prob. 10BSCCh. 2.3 - Frequency Polygon. In Exercises 15 and 16,...Ch. 2.3 - Frequency Polygon. In Exercises 15 and 16,...Ch. 2.3 - Prob. 17BSCCh. 2.3 - Deceptive Graphs. In Exercises 17-20, identify how...Ch. 2.3 - Prob. 19BSCCh. 2.3 - Deceptive Graphs. In Exercises 17-20, identify how...Ch. 2.4 - Linear Correlation In this section we use r to...Ch. 2.4 - Prob. 2BSCCh. 2.4 - Prob. 3BSCCh. 2.4 - Prob. 4BSCCh. 2.4 - Scatterplot. In Exercises 58, use the sample data...Ch. 2.4 - Prob. 6BSCCh. 2.4 - Prob. 7BSCCh. 2.4 - Prob. 8BSCCh. 2.4 - Prob. 9BSCCh. 2.4 - Linear Correlation Coefficient In Exercises 9-12,...Ch. 2.4 - Prob. 11BSCCh. 2.4 - Prob. 12BSCCh. 2.4 - Prob. 13BBCh. 2.4 - P-Values In Exercises 13-16, write a statement...Ch. 2.4 - Prob. 15BBCh. 2.4 - Prob. 16BBCh. 2 - Cookies Refer to the accompanying frequency...Ch. 2 - Cookies Using the same frequency distribution from...Ch. 2 - Prob. 3CQQCh. 2 - Cookies A stemplot of the same cookies summarized...Ch. 2 - Computers As a quality control manager at Texas...Ch. 2 - Prob. 6CQQCh. 2 - Prob. 7CQQCh. 2 - Prob. 8CQQCh. 2 - Prob. 9CQQCh. 2 - Prob. 10CQQCh. 2 - Frequency Distribution of Body Temperatures...Ch. 2 - Prob. 2RECh. 2 - Prob. 5RECh. 2 - Prob. 6RECh. 2 - Prob. 1CRECh. 2 - In Exercises 1-6, refer to the data below, which...Ch. 2 - Prob. 3CRECh. 2 - Prob. 4CRECh. 2 - Prob. 6CRECh. 2 - Prob. 1TPPCh. 2 - Fast Food Restaurant Drive-Through Service Times:...Ch. 2 - Prob. 2FDDCh. 2 - Fast Food Restaurant Drive-Through Service Times:...Ch. 2 - Prob. 4FDDCh. 2 - Prob. 5FDD
Knowledge Booster


Learn more about
Need a deep-dive on the concept behind this application? Look no further. Learn more about this topic, statistics and related others by exploring similar questions and additional content below.Similar questions
- Determine if the two statements are equalivalent using a truth tablearrow_forwardQuestion 3: p and q represent the following simple statements. p: Calgary is the capital of Alberta. A) Determine the value of each simple statement p and q. B) Then, without truth table, determine the va q: Alberta is a province of Canada. for each following compound statement below. pvq р^~q ~рл~q ~q→ p ~P~q Pq b~ (d~ ← b~) d~ (b~ v d) 0 4arrow_forward2. Let X be a random variable. (a) Show that, if E X2 = 1 and E X4arrow_forward1. Show that, for any non-negative random variable X, EX+E+≥2, X E max X. 21.arrow_forwarda small pond contains eight catfish and six bluegill. If seven fish are caught at random, what is the probability that exactly five catfish have been caught?arrow_forward23 The line graph in the following figure shows Revenue ($ millions) one company's revenues over time. Explain why this graph is misleading and what you can do to fix the problem. 700 60- 50- 40 30 Line Graph of Revenue 20- 101 1950 1970 1975 1980 1985 Year 1990 2000arrow_forwardd of the 20 respectively. Interpret the shape, center and spread of the following box plot. 14 13 12 11 10 6 T 89 7 9 5. 治arrow_forwardF Make a box plot from the five-number summary: 100, 105, 120, 135, 140. harrow_forward14 Is the standard deviation affected by skewed data? If so, how? foldarrow_forwardFrequency 15 Suppose that your friend believes his gambling partner plays with a loaded die (not fair). He shows you a graph of the outcomes of the games played with this die (see the following figure). Based on this graph, do you agree with this person? Why or why not? 65 Single Die Outcomes: Graph 1 60 55 50 45 40 1 2 3 4 Outcome 55 6arrow_forwardlie y H 16 The first month's telephone bills for new customers of a certain phone company are shown in the following figure. The histogram showing the bills is misleading, however. Explain why, and suggest a solution. Frequency 140 120 100 80 60 40 20 0 0 20 40 60 80 Telephone Bill ($) 100 120arrow_forward25 ptical rule applies because t Does the empirical rule apply to the data set shown in the following figure? Explain. 2 6 5 Frequency 3 сл 2 1 0 2 4 6 8 00arrow_forwardarrow_back_iosSEE MORE QUESTIONSarrow_forward_ios
Recommended textbooks for you
 Glencoe Algebra 1, Student Edition, 9780079039897...AlgebraISBN:9780079039897Author:CarterPublisher:McGraw Hill
 Holt Mcdougal Larson Pre-algebra: Student Edition...AlgebraISBN:9780547587776Author:HOLT MCDOUGALPublisher:HOLT MCDOUGAL
 Big Ideas Math A Bridge To Success Algebra 1: Stu...AlgebraISBN:9781680331141Author:HOUGHTON MIFFLIN HARCOURTPublisher:Houghton Mifflin Harcourt
Glencoe Algebra 1, Student Edition, 9780079039897...
Algebra
ISBN:9780079039897
Author:Carter
Publisher:McGraw Hill
Holt Mcdougal Larson Pre-algebra: Student Edition...
Algebra
ISBN:9780547587776
Author:HOLT MCDOUGAL
Publisher:HOLT MCDOUGAL
Big Ideas Math A Bridge To Success Algebra 1: Stu...
Algebra
ISBN:9781680331141
Author:HOUGHTON MIFFLIN HARCOURT
Publisher:Houghton Mifflin Harcourt
Grade 12 and UG/ Introduction to logical statements and truth tables; Author: Dr Trefor Bazett;https://www.youtube.com/watch?v=q2eyZZK-OIk;License: Standard YouTube License, CC-BY