
1.
Construct a cost-volume-profit chart indicating the break-even sales for last year, and verify the answer using the break-even equation.
1.
Explanation of Solution
Cost-Volume-Profit Analysis: It is a method followed to analyze the relationship between the sales, costs, and the related profit or loss at various levels of units sold. In other words, it shows the effect of the changes in the cost and the sales volume on the operating income of the company.
Construct a cost-volume-profit chart indicating the break-even sales for last year.
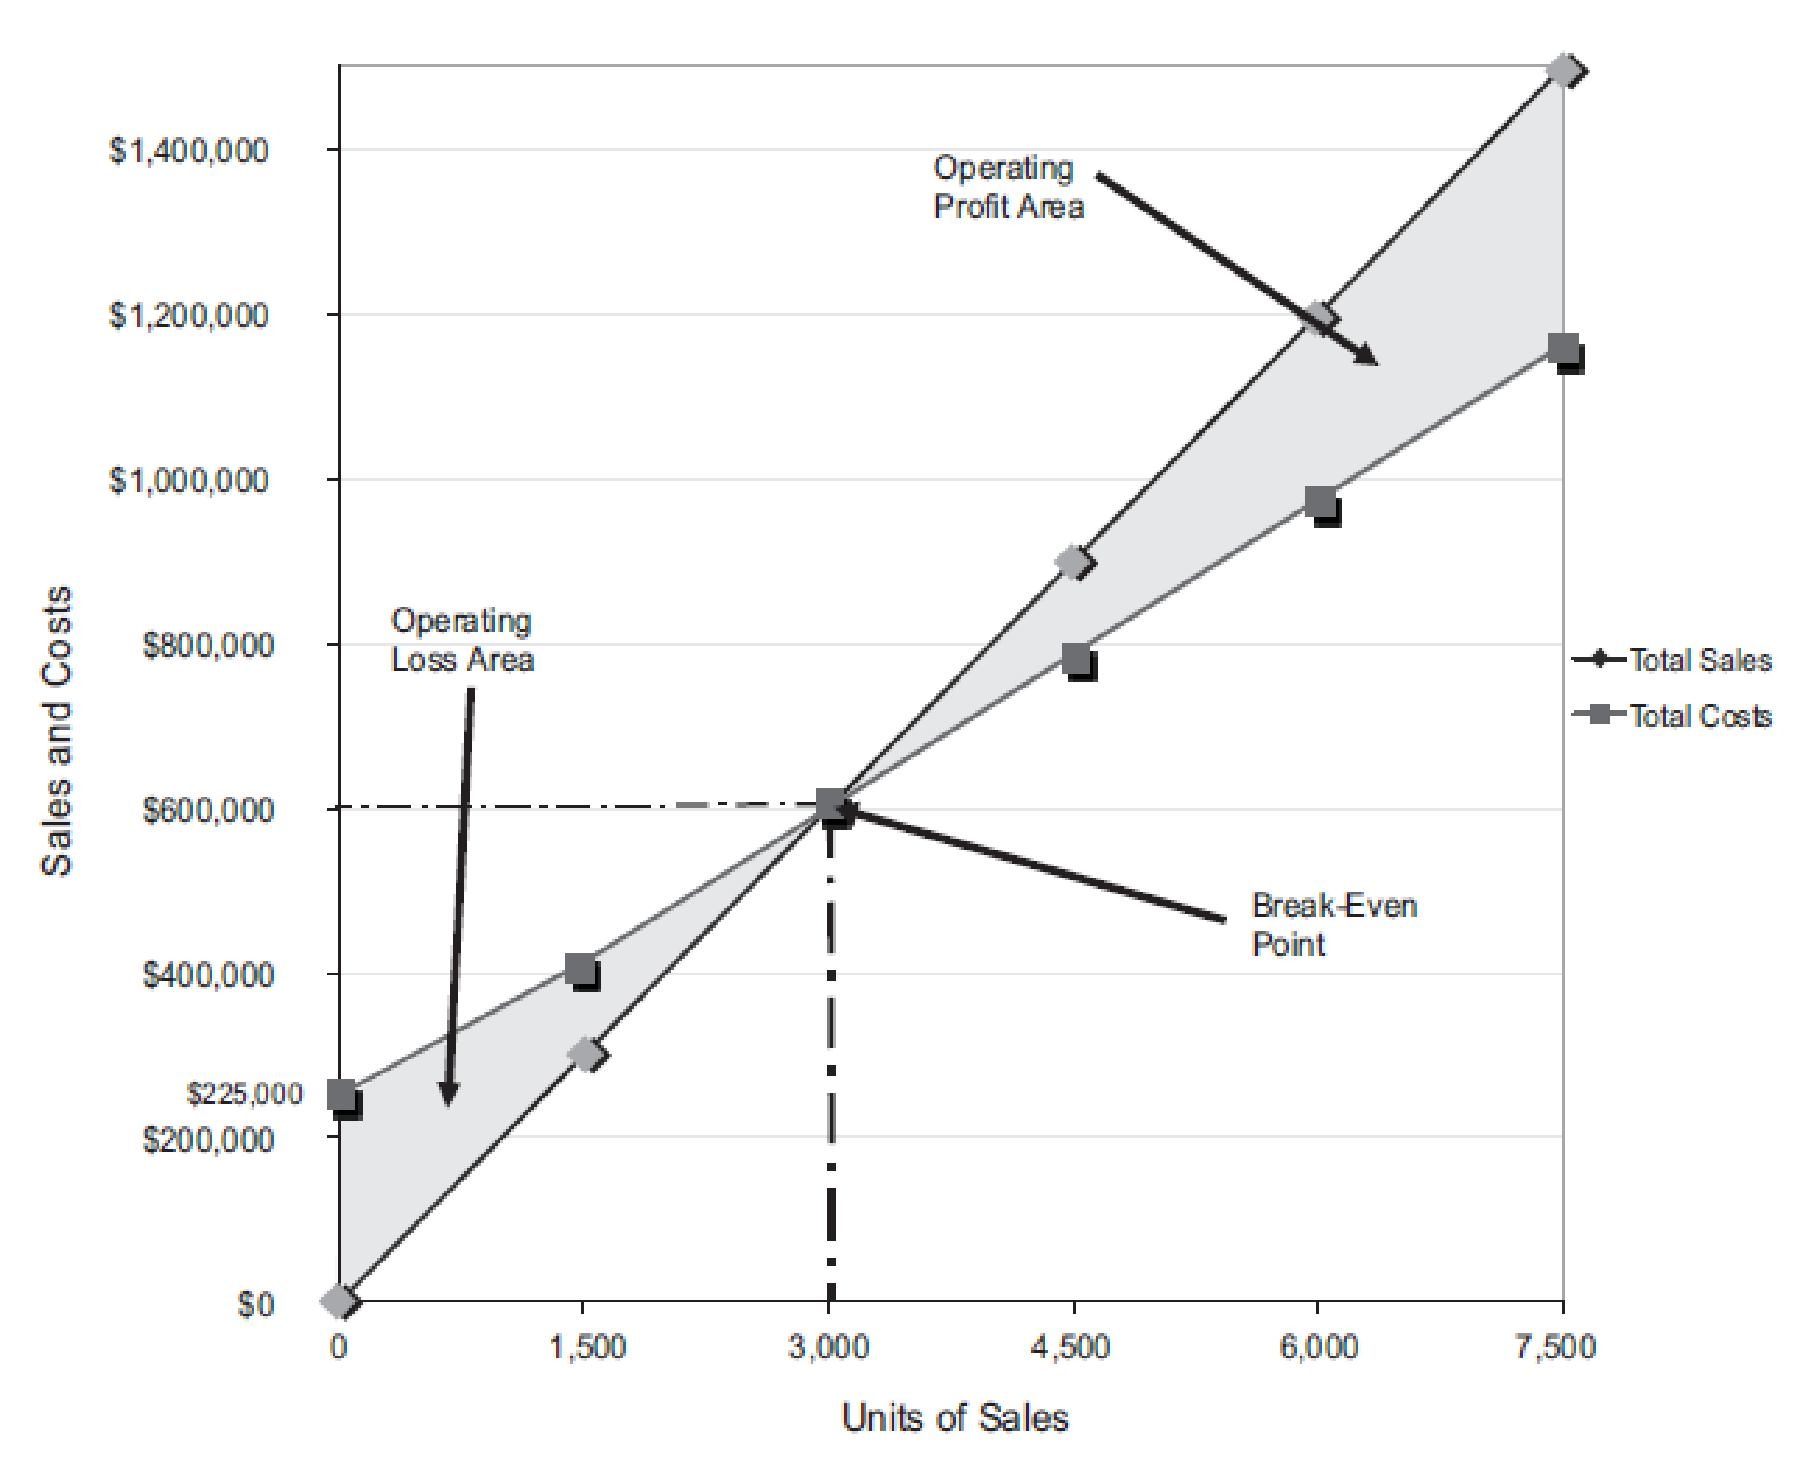
Figure (1)
The volume in units of sales is shown on the horizontal axis. The maximum relevant range is 7,500 units. The sales and the total costs (fixed cost and variable cost) in dollars is shown on the vertical axis. The maximum relevant range of sales and total costs is $1,500,000.
The total sales line is drawn right upward by connecting the first point at $0 to the second point at $1,500,000
The total cost line is drawn right upward by connecting the first point at $225,000 (fixed cost) on the vertical axis to the second point at $1,162,500
The break-even point is the intersection point where the total sales line and total cost line meet. The vertical dotted line drawn downward from the intersection point reaches at 3,000 units. It indicates the break-even sales (units). The horizontal line drawn to the left towards the vertical axis reaches at $600,000. It indicates the break-even sales (dollars).
The operating profit area is the area where the total sales line exceeds the total cost line. However, the operating loss area is the area where the total cost exceeds the total sales line.
Verify the answer using the break-even equation.
Determine the break-even sales in units.
Fixed cost =$225,000
Contribution margin per unit =$75 per unit (1)
Determine the break-even sales in dollars.
Fixed cost =$225,000
Contribution margin ratio =37.5% (2)
Working note (1):
Compute the contribution margin per unit.
Selling price per unit =$200 per unit
Variable cost per unit =$125 per unit
Working note (2):
Determine the contribution margin ratio.
Contribution margin =$75 per unit (1)
Selling price per unit =$200 per unit
2(A)
Compute the income from operations for last year and (B) the maximum income from operations that could have been realized during the year using the cost-volume-profit chart, and verify the answers using the mathematical approach to cost-volume-profit analysis.
2(A)
Explanation of Solution
Determine the income from operations for last year and (B) the maximum income from operations that could have been realized during the year.
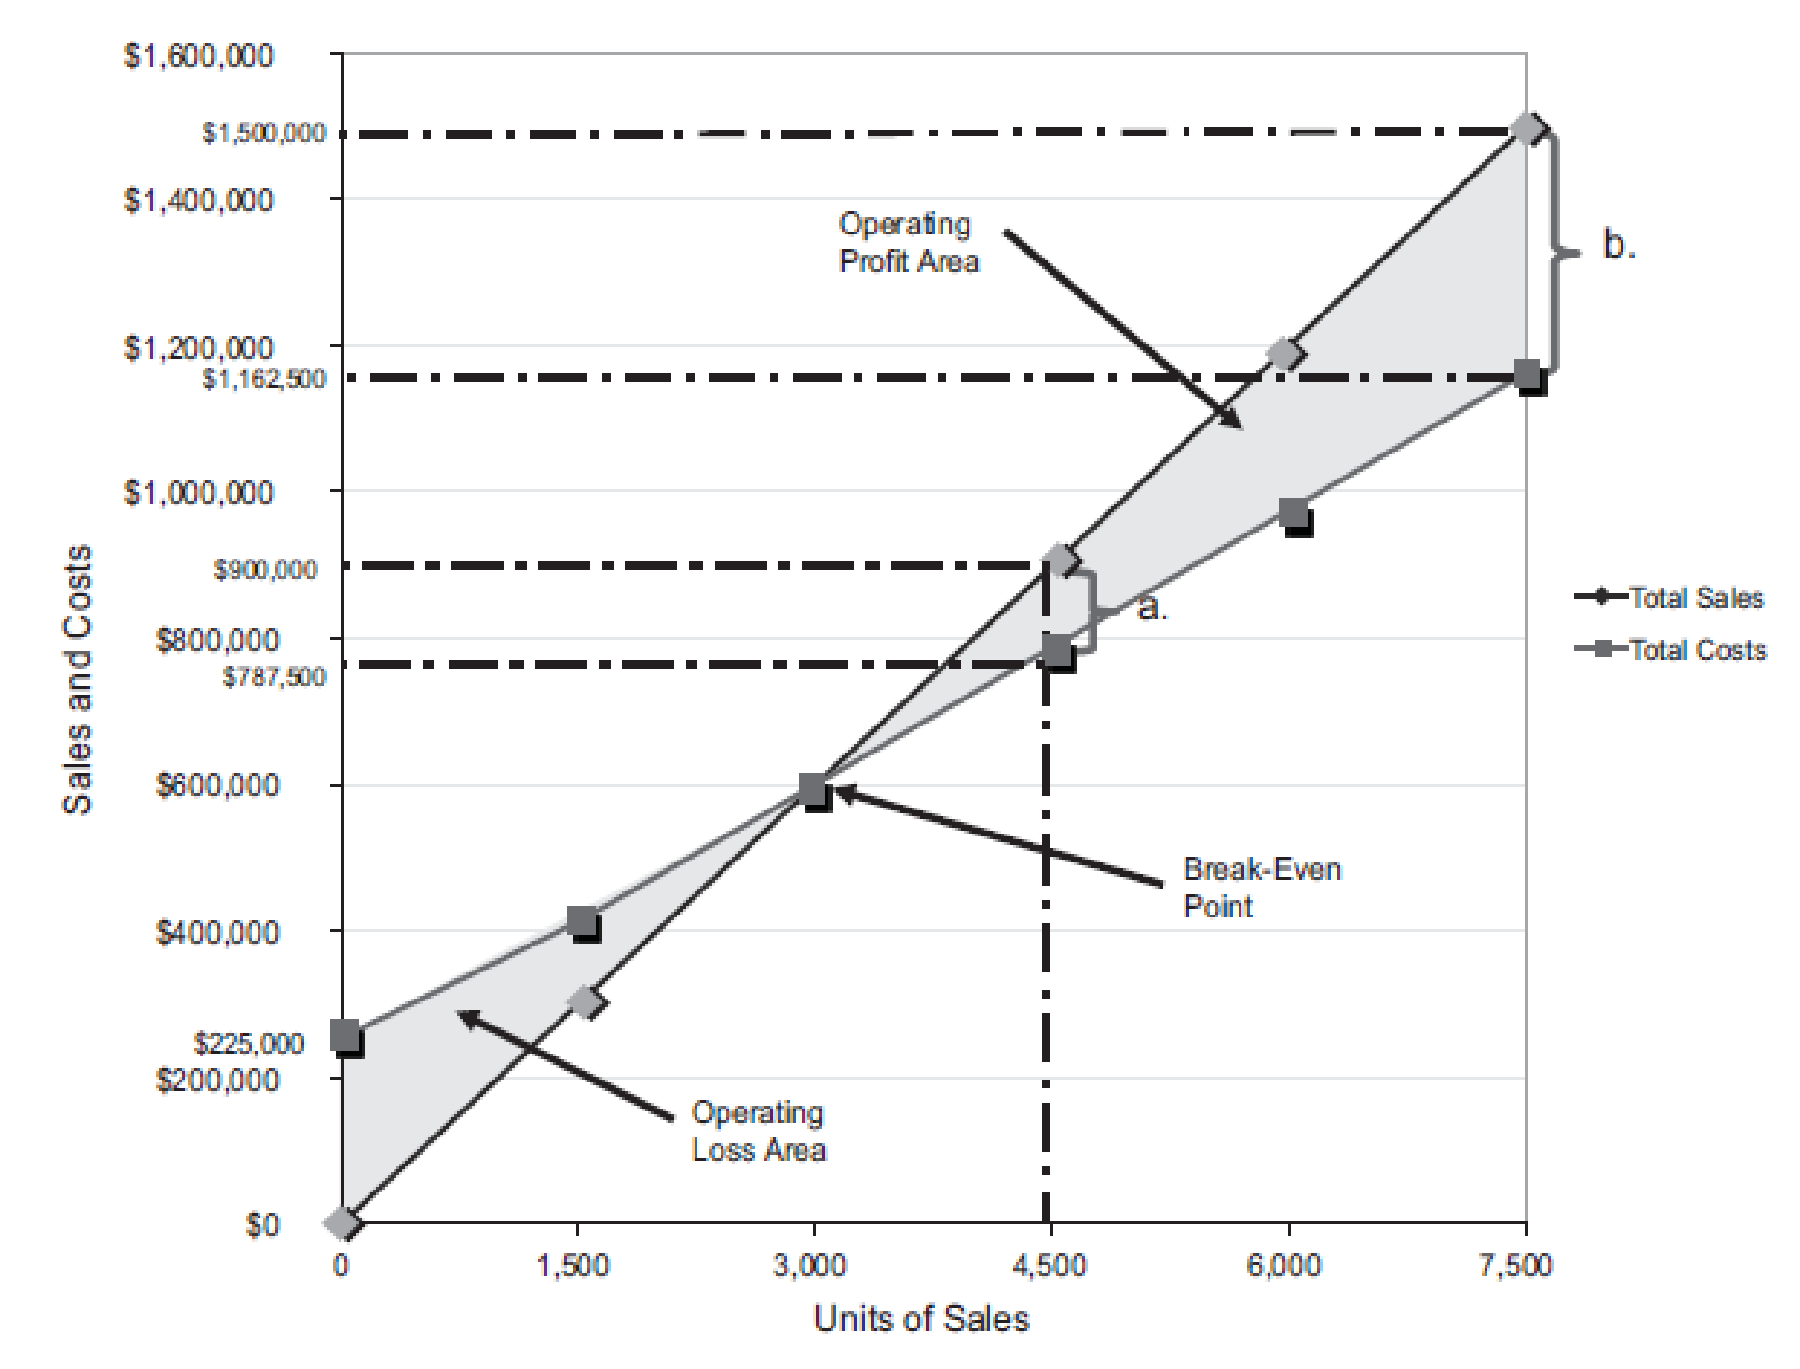
Figure (2)
Last year, the number of units sold is 4,500 units (3). The total sales is $900,000. The total cost is
Similarly, a dotted line is drawn from the total cost at $787,500 on the vertical axis towards the right and a dotted line is drawn upward for the 4,500 units sold from the horizontal axis. The two dotted line meet at a point which indicates the point of total cost at 4,500 units.
The dotted line from sales is above the dotted line for total cost. This indicates the income from operations. Thus, the area in between the two dotted lines is the income from operations of
Verify the answers using the mathematical approach to cost-volume-profit analysis.
Determine the income from operations for the last year.
| Determine the income from operations for 4,500 units | ||
| Particulars | Amount ($) | Amount ($) |
| Sales | 900,000 | |
| Less: Fixed costs | 225,000 | |
| Variable costs | 562,500 | (787,500) |
| Income from operations | 112,500 | |
Table (1)
Working note (3):
Determine the number of units sold.
Sales =$900,000
Selling price per unit =$200 per unit
2(B)
Compute the maximum income from operations realized during the year, and verify the answer.
2(B)
Explanation of Solution
The maximum relevant range for number of units to be sold is 7,500 units. Thus, the total sales is
Similarly, a dotted line is drawn from the total cost at $1,162,500 on the vertical axis towards the right and a dotted line is drawn upward for the 7,500 units sold from the horizontal axis. The two dotted line meet at a point which indicates the point of total cost at 7,500 units.
The dotted line from sales is above the dotted line for total cost. This indicates the income from operations. Thus, the area in between the two dotted lines is the income from operations of
Verification:
Compute the maximum income from operations that could have been realized during the year.
| Determine the income from operations for 7,500 units | ||
| Particulars | Amount ($) | Amount ($) |
| Sales | 1,500,000 | |
| Less: Fixed costs | 225,000 | |
| Variable costs | 937,500 | (1,162,500) |
| Income from operations | 337,500 | |
Table (2)
3.
Construct a cost-volume-profit chart indicating the break-even sales for the current year, verify the answer using the break-even equation.
3.
Explanation of Solution
Construct a cost-volume-profit chart indicating the break-even sales for the current year.
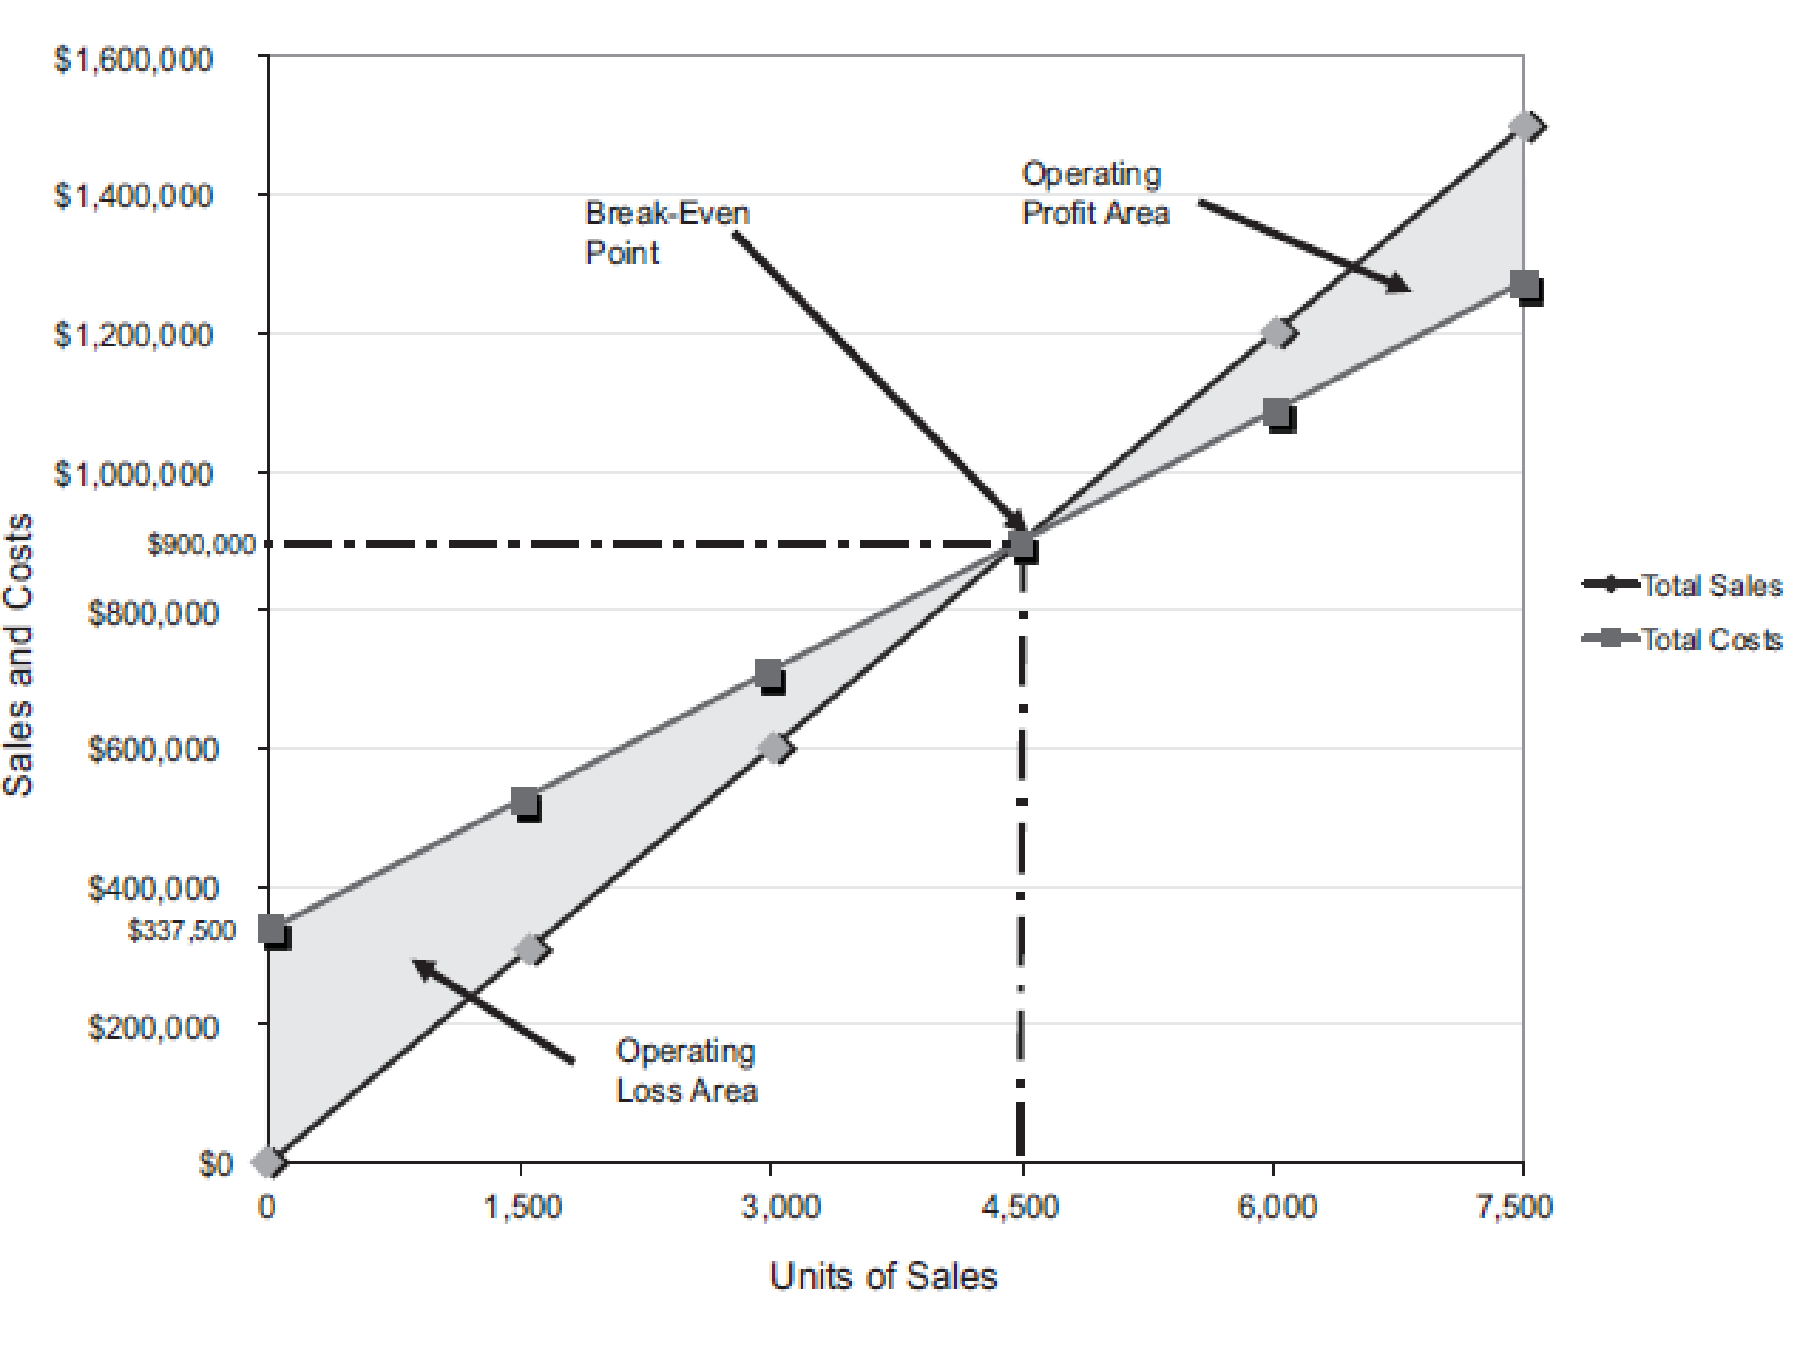
Figure (3)
The volume in units of sales is shown on the horizontal axis. The maximum relevant range is 7,500 units. The sales and the total costs (fixed cost and variable cost) in dollars is shown on the vertical axis. The maximum relevant range of sales and total costs is $1,600,000.
The total sales line is drawn right upward by connecting the first point at $0 to the second point at $900,000
The total cost line is drawn right upward by connecting the first point at
The break-even point is the intersection point where the total sales line and total cost line meet. The vertical dotted line drawn downward from the intersection point reaches at 4,500 units. It indicates the break-even sales (units). The horizontal line drawn to the left towards the vertical axis reaches at $900,000. It indicates the break-even sales (dollars).
The operating profit area is the area where the total sales line exceeds the total cost line. However, the operating loss area is the area where the total cost exceeds the total sales line.
Verify the answer using the break-even equation.
Determine the break-even sales in units.
Fixed cost =$225,000
Increase in fixed cost (billboard advertising) =$112,500
Contribution margin per unit =$75 per unit (1)
Determine the break-even sales in dollars.
Fixed cost =$225,000
Increase in fixed cost (billboard advertising) =$112,500
Contribution margin ratio =37.5% (2)
4(A)
Compute the income from operations for sales 6,000 units and (B) the maximum income from operations that could have been realized during the year using the cost-volume-profit chart, and verify the answer.
4(A)
Explanation of Solution
Determine (A) the income from operations for sales 6,000 units and (B) the maximum income from operations that could have been realized during the year.
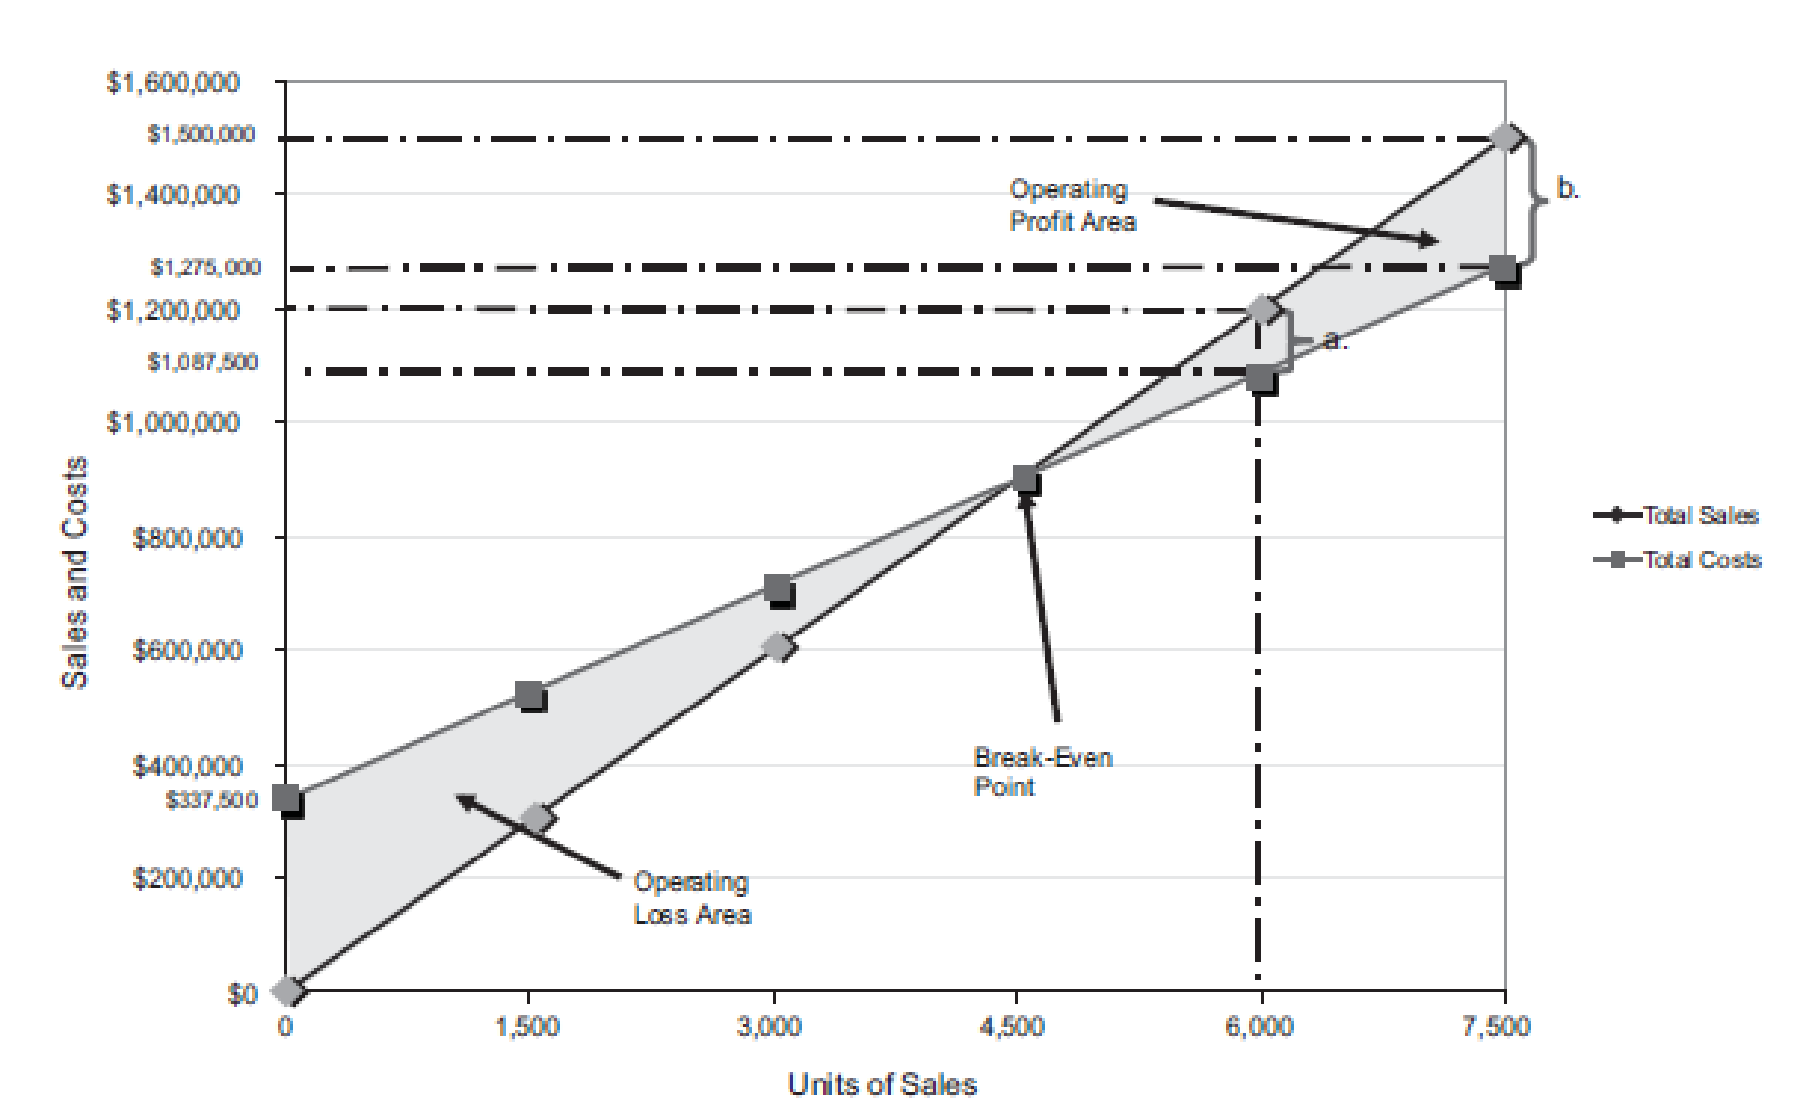
Figure (4)
The number of units sold is 6,000 units. The total sales is
Similarly, a dotted line is drawn from the total cost at $1,087,500 on the vertical axis towards the right and a dotted line is drawn upward for the 6,000 units sold from the horizontal axis. The two dotted line meet at a point which indicates the point of total cost at 6,000 units.
The dotted line from sales is above the dotted line for total cost. This indicates the income from operations. Thus, the area in between the two dotted lines is the income from operations of
Verification:
Determine the income from operations for the last year.
| Determine the income from operations for 6,000 units | ||
| Particulars | Amount ($) | Amount ($) |
| Sales | 1,200,000 | |
| Less: Total Fixed costs | 337,500 | |
| Variable costs | 750,000 | (1,087,500) |
| Income from operations | 112,500 | |
Table (3)
4(B)
Compute the maximum income from operations that could have been realized during the year and verify the answer.
4(B)
Explanation of Solution
The maximum relevant range for number of units to be sold is 7,500 units. Thus, the total sales is
Similarly, a dotted line is drawn from the total cost at $1,275,000 on the vertical axis towards the right and a dotted line is drawn upward for the 7,500 units sold from the horizontal axis. The two dotted line meet at a point which indicates the point of total cost at 7,500 units.
The dotted line from sales is above the dotted line for total cost. This indicates the income from operations. Thus, the area in between the two dotted lines is the income from operations of
Verification:
Determine the maximum income from operations that could have been realized during the year.
| Determine the income from operations for 7,500 units | ||
| Particulars | Amount ($) | Amount ($) |
| Sales | 1,500,000 | |
| Less: Total Fixed costs | 337,500 | |
| Variable costs | 937,500 | (1,275,000) |
| Income from operations | 225,000 | |
Table (4)
Want to see more full solutions like this?
Chapter 20 Solutions
FINANCIAL&MANAGERIAL ACCOUNTING(LL)W/AC

- Can you help me solve this general accounting problem using the correct accounting process?arrow_forwardHow can I solve this financial accounting problem using the appropriate financial process?arrow_forwardPlease provide the accurate answer to this general accounting problem using valid techniquesarrow_forward
- I need help with this general accounting question using the proper accounting approach.arrow_forwardCan you explain the correct methodology to solve this general accounting problem?arrow_forwardDetermine the amount of the Earned Income Credit in each of the following cases. Assume that the person or persons are eligible to take the credit. Calculate the credit using the formulas. A single person with earned income of $ 7 , 8 5 4 and no qualifying children. A single person with earned income of $ 2 7 , 5 0 0 and two qualifying children. A married couple filing jointly with earned income of $ 3 4 , 1 9 0 and one qualifying child.arrow_forward
- Please help me solve this general accounting question using the right accounting principles.arrow_forwardAssets Martinez Company Comparative Balance Sheets December 31 2025 2024 Cash $91,000 $52,000 Accounts receivable 52,000 36,400 Inventory 72,800 52,000 Property, plant, and equipment 156,000 202,800 Accumulated depreciation Total (83,200) [62,400) $288,600 $290,800 Liabilities and Stockholders' Equity Accounts payable $49,400 $ 39,000 Income taxes payable 18,200 20,800 Bonds payable 44,200 85,800 Common stock 46,900 36,400 Retained earnings 130,000 98,800 Total $288,600 $280,800 Martinez Company Income Statement For the Year Ended December 31, 2025 Sales revenue $629,200 Cost of goods sold 455,000 Gross profit 174,200 Selling expenses $46,800 Administrative expenses 15,600 62,400 Income from operations 111,800 Interest expense 7,800 Income before income taxes 104,000 Income tax expense 20,800 Net income $83,200 Additional data: 1. Depreciation expense was $45,500. 2. Dividends declared and paid were $52,000. 3. During the year, equipment was sold for $22,100 cash. This equipment…arrow_forwardagree or disagree with post The Stockholders' Equity section of a corporate balance sheet fundamentally differs from that of a single-owner business due to the inherent structure of a corporation versus a sole proprietorship. In a single-owner business, you'll usually see a single "Owner's Equity" account, which reflects the owner's investment, withdrawals, and accumulated profits or losses. Conversely, a corporation's Stockholders' Equity is more intricate, reflecting the contributions of multiple owners (stockholders) and the legal framework governing corporate capital. It's divided into contributed capital, which includes common and preferred stock, and retained earnings, which represents accumulated profits not yet distributed as dividends. Additionally, corporations may have accounts like "Additional Paid-in Capital" to capture amounts received above the par value of stock, and "Treasury Stock" to account for shares repurchased by the company. This detailed breakdown highlights…arrow_forward
- East Georgia Community Hospital enters into a contract to provide $15,000 of elective medical care to a patient. After a review of the patient's ability and intent to pay, the hospital does not expect to collect the full contract price of $15,000. However, the hospital occasionally performs "discounted" procedures to members of the community to enhance its standing in the local area. While the hospital invoiced the customer for the full amount of the services, it only expects to collect $10,000. What amount of revenue should the hospital recognize?arrow_forwardOn January 1, Flint Corporation had 62,900 shares of no-par common stock issued and outstanding. The stock has a stated value of $4 per share. During the year, the following transactions occurred. Apr. 1 Issued 18,000 additional shares of common stock for $13 per share. June 15 Declared a cash dividend of $1.95 per share to stockholders of record on June 30. July 10 Paid the $1.95 cash dividend. Dec. 1 Issued 8,000 additional shares of common stock for $13 per share. Dec. 15 Declared a cash dividend on outstanding shares of $2.25 per share to stockholders of record on December 31. (a) Prepare the entries on each of the three dates that involved dividends. (Record journal entries in the order presented in the problem. Credit account titles are automatically indented when amount is entered. Do not indent manually. If no entry is required, select "No Entry" for the account titles and enter O for the amount in the relevant debit OR credit box. Entering zero in ALL boxes will result in the…arrow_forwardFinancial accounting Problemarrow_forward
 Cornerstones of Cost Management (Cornerstones Ser...AccountingISBN:9781305970663Author:Don R. Hansen, Maryanne M. MowenPublisher:Cengage Learning
 Excel Applications for Accounting PrinciplesAccountingISBN:9781111581565Author:Gaylord N. SmithPublisher:Cengage Learning
 Managerial AccountingAccountingISBN:9781337912020Author:Carl Warren, Ph.d. Cma William B. TaylerPublisher:South-Western College Pub