
1.
Construct a cost-volume-profit chart indicating the break-even sales for last year, and verify the answer using the break-even equation.
1.
Explanation of Solution
Cost-Volume-Profit Analysis: It is a method followed to analyze the relationship between the sales, costs, and the related profit or loss at various levels of units sold. In other words, it shows the effect of the changes in the cost and the sales volume on the operating income of the company.
Construct a cost-volume-profit chart indicating the break-even sales for last year.
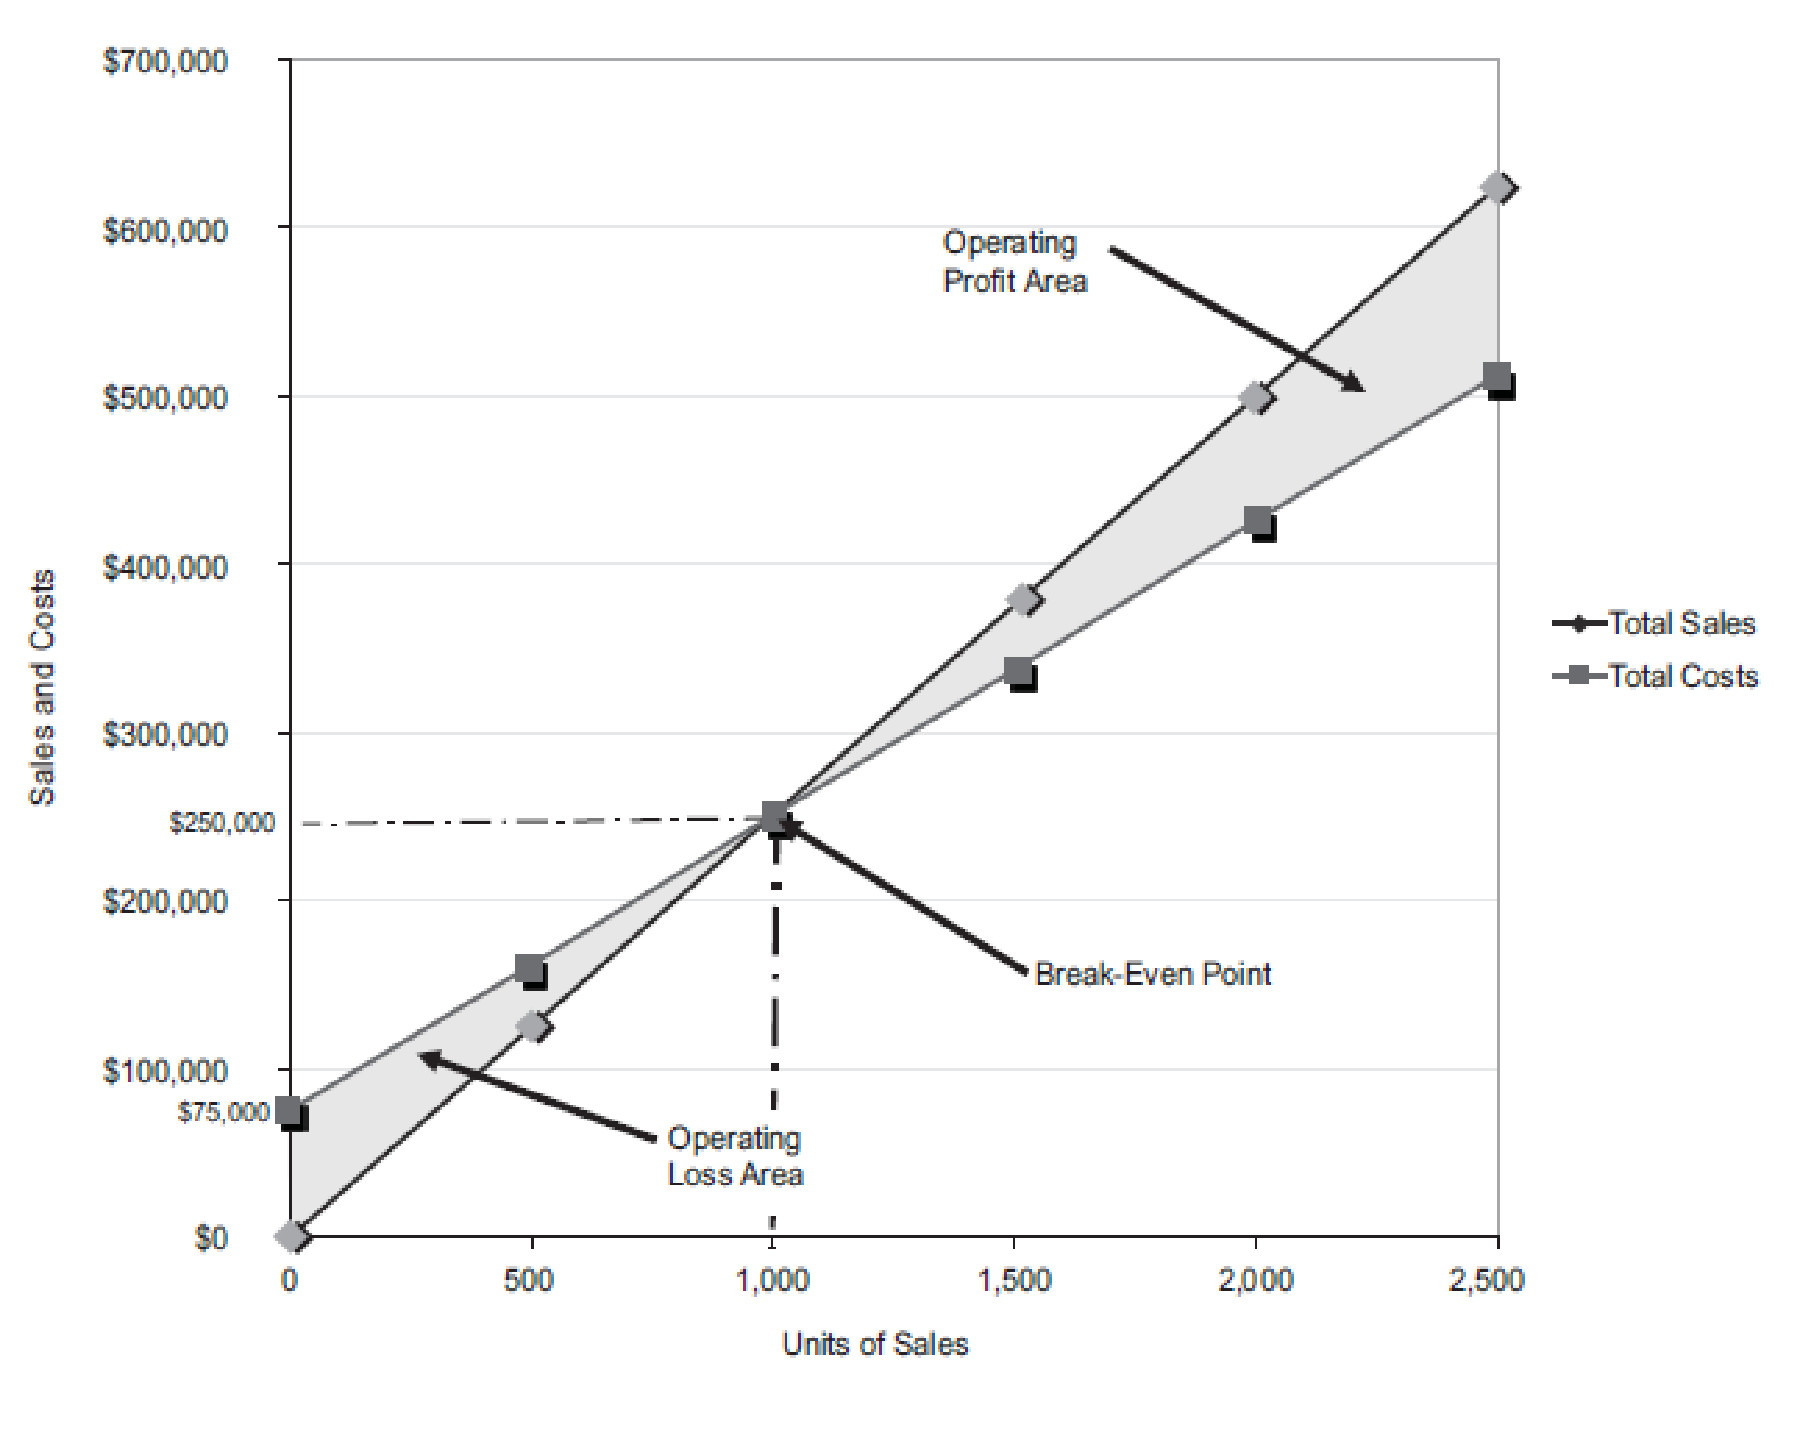
Figure (1)
The volume in units of sales is shown on the horizontal axis. The maximum relevant range is 2,500 units. The sales and the total costs (fixed cost and variable cost) in dollars is shown on the vertical axis. The maximum relevant range of sales and total costs is $700,000.
The total sales line is drawn right upward by connecting the first point at $0 to the second point at $625,000
The total cost line is drawn right upward by connecting the first point at $75,000 (fixed cost) on the vertical axis to the second point at $512,500
The break-even point is the intersection point where the total sales line and total cost line meet. The vertical dotted line drawn downward from the intersection point reaches at 1,000 units. It indicates the break-even sales (units). The horizontal line drawn to the left towards the vertical axis reaches at $250,000. It indicates the break-even sales (dollars).
The operating profit area is the area where the total sales line exceeds the total cost line. However, the operating loss area is the area where the total cost exceeds the total sales line.
Verify the answer using the break-even equation as follows:
Determine the break-even sales in units.
Fixed cost =$75,000
Contribution margin per unit =$75 per unit (1)
Determine the break-even sales in dollars.
Fixed cost =$75,000
Contribution margin ratio =30% (2)
Working note (1):
Compute the contribution margin per unit.
Selling price per unit =$250 per unit
Variable cost per unit =$175 per unit
Working note (2):
Determine the contribution margin ratio.
Contribution margin =$75 per unit (1)
Selling price per unit =$250 per unit
2(A)
Compute the income from operations for last year.
2(A)
Explanation of Solution
Compute the income from operations for last year as follows:
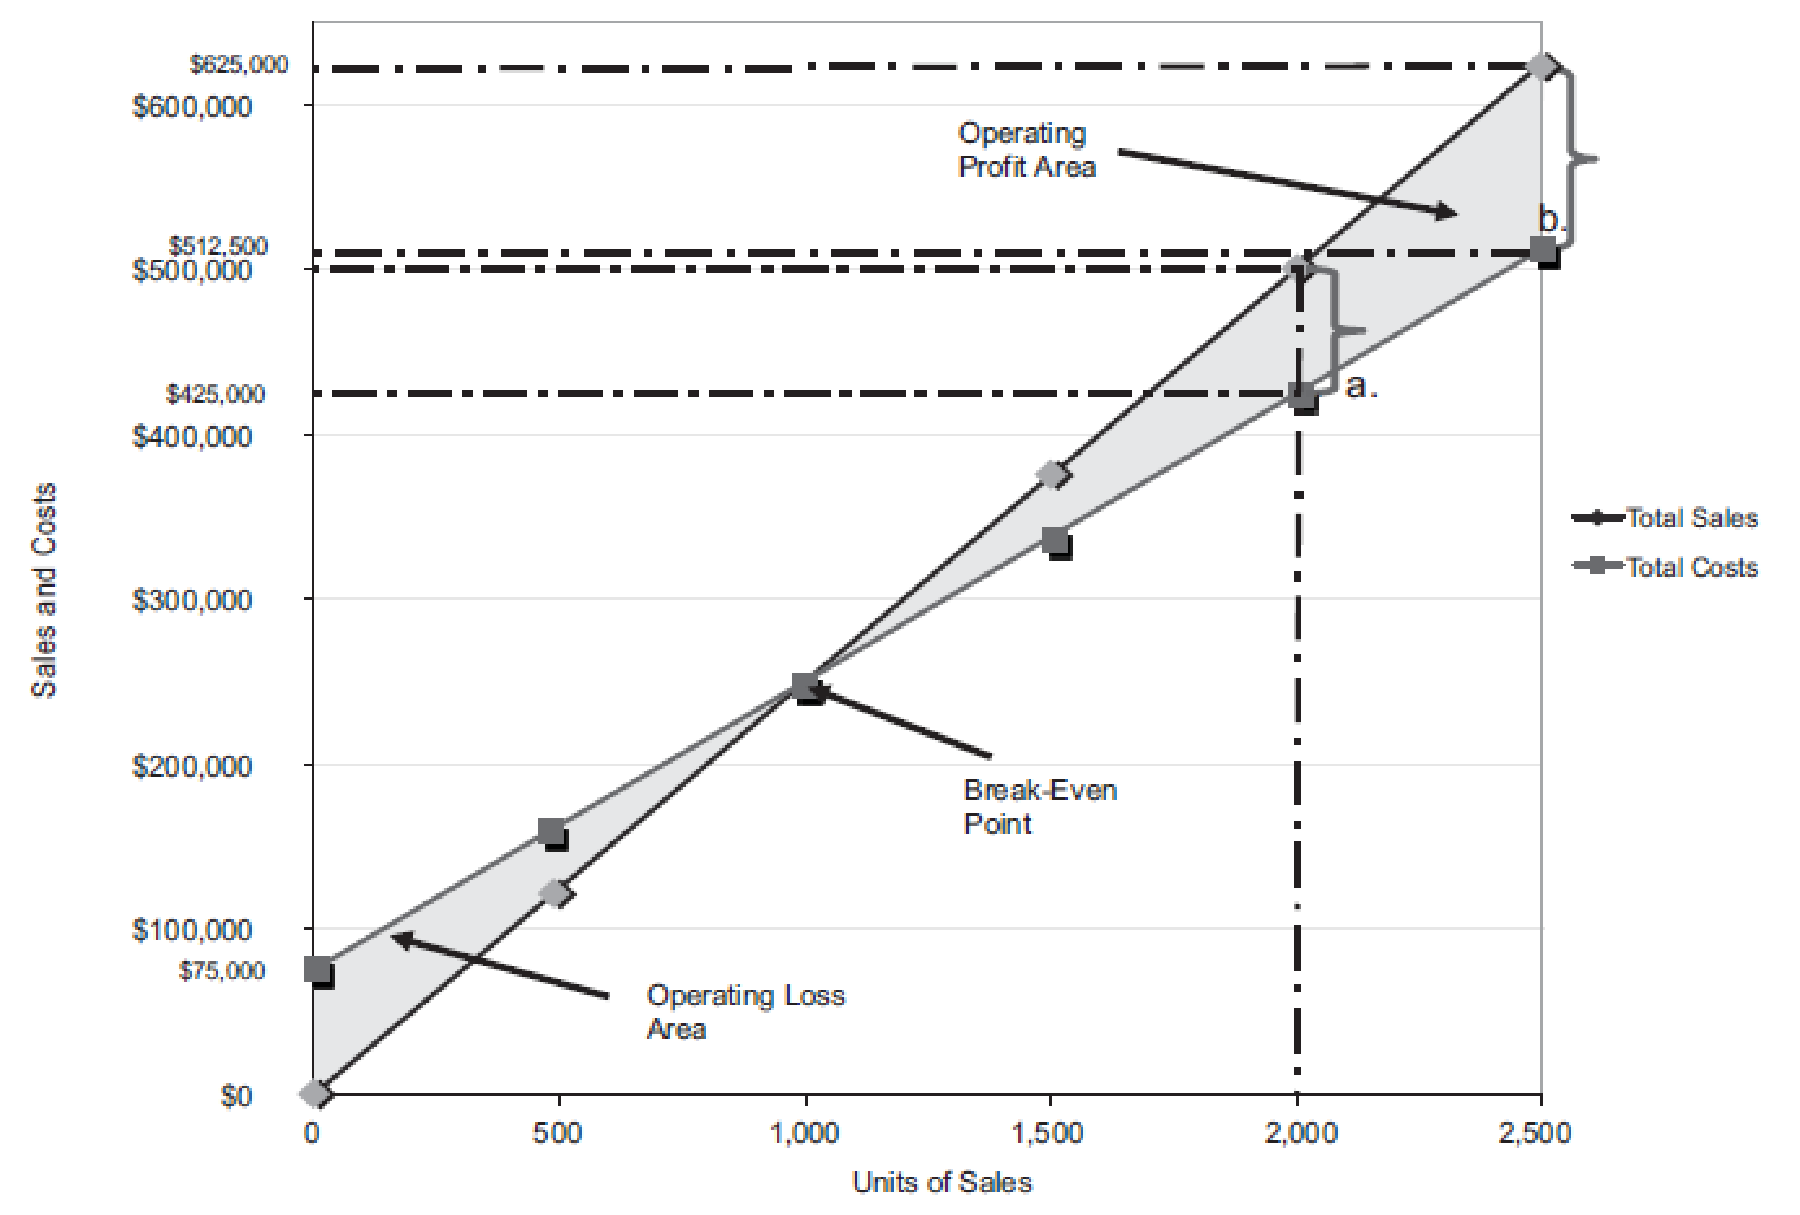
Figure (2)
Last year, the number of units sold is 2,000 units (3). The total sales is $500,000. The total cost is
Similarly, a dotted line is drawn from the total cost at $425,000 on the vertical axis towards the right and a dotted line is drawn upward for the 2,000 units sold from the horizontal axis. The two dotted line meet at a point which indicates the point of total cost at 2,000 units.
The dotted line from sales is above the dotted line for total cost. This indicates the income from operations. Thus, the area in between the two dotted lines is the income from operations of
Verify the answers using the mathematical approach to cost-volume-profit analysis.
Determine the income from operations for the last year.
| Determine the income from operations for 2,000 units | ||
| Particulars | Amount ($) | Amount ($) |
| Sales | 500,000 | |
| Less: Fixed costs | 75,000 | |
| Variable costs | 350,000 | (425,000) |
| Income from operations | 75,000 | |
Table (1)
Working note (3):
Determine the number of units sold.
Sales =$500,000
Selling price per unit =$250 per unit
2(B)
Compute the maximum income from operations realized during the year.
2(B)
Explanation of Solution
The maximum relevant range for number of units to be sold is 2,500 units. Thus, the total sale is
Similarly, a dotted line is drawn from the total cost at $512,500 on the vertical axis towards the right and a dotted line is drawn upward for the 2,500 units sold from the horizontal axis. The two dotted line meet at a point which indicates the point of total cost at 2,500 units.
The dotted line from sales is above the dotted line for total cost. This indicates the income from operations. Thus, the area in between the two dotted lines is the income from operations of
Determine the maximum income from operations that could have been realized during the year.
| Determine the income from operations for 2,500 units | ||
| Particulars | Amount ($) | Amount ($) |
| Sales | 625,000 | |
| Less: Fixed costs | 75,000 | |
| Variable costs | 437,500 | (512,500) |
| Income from operations | 112,500 | |
Table (2)
3.
Construct a cost-volume-profit chart indicating the break-even sales for the current year, and verify the answer using the break-even equation.
3.
Explanation of Solution
Construct a cost-volume-profit chart indicating the break-even sales for the current year as follows:
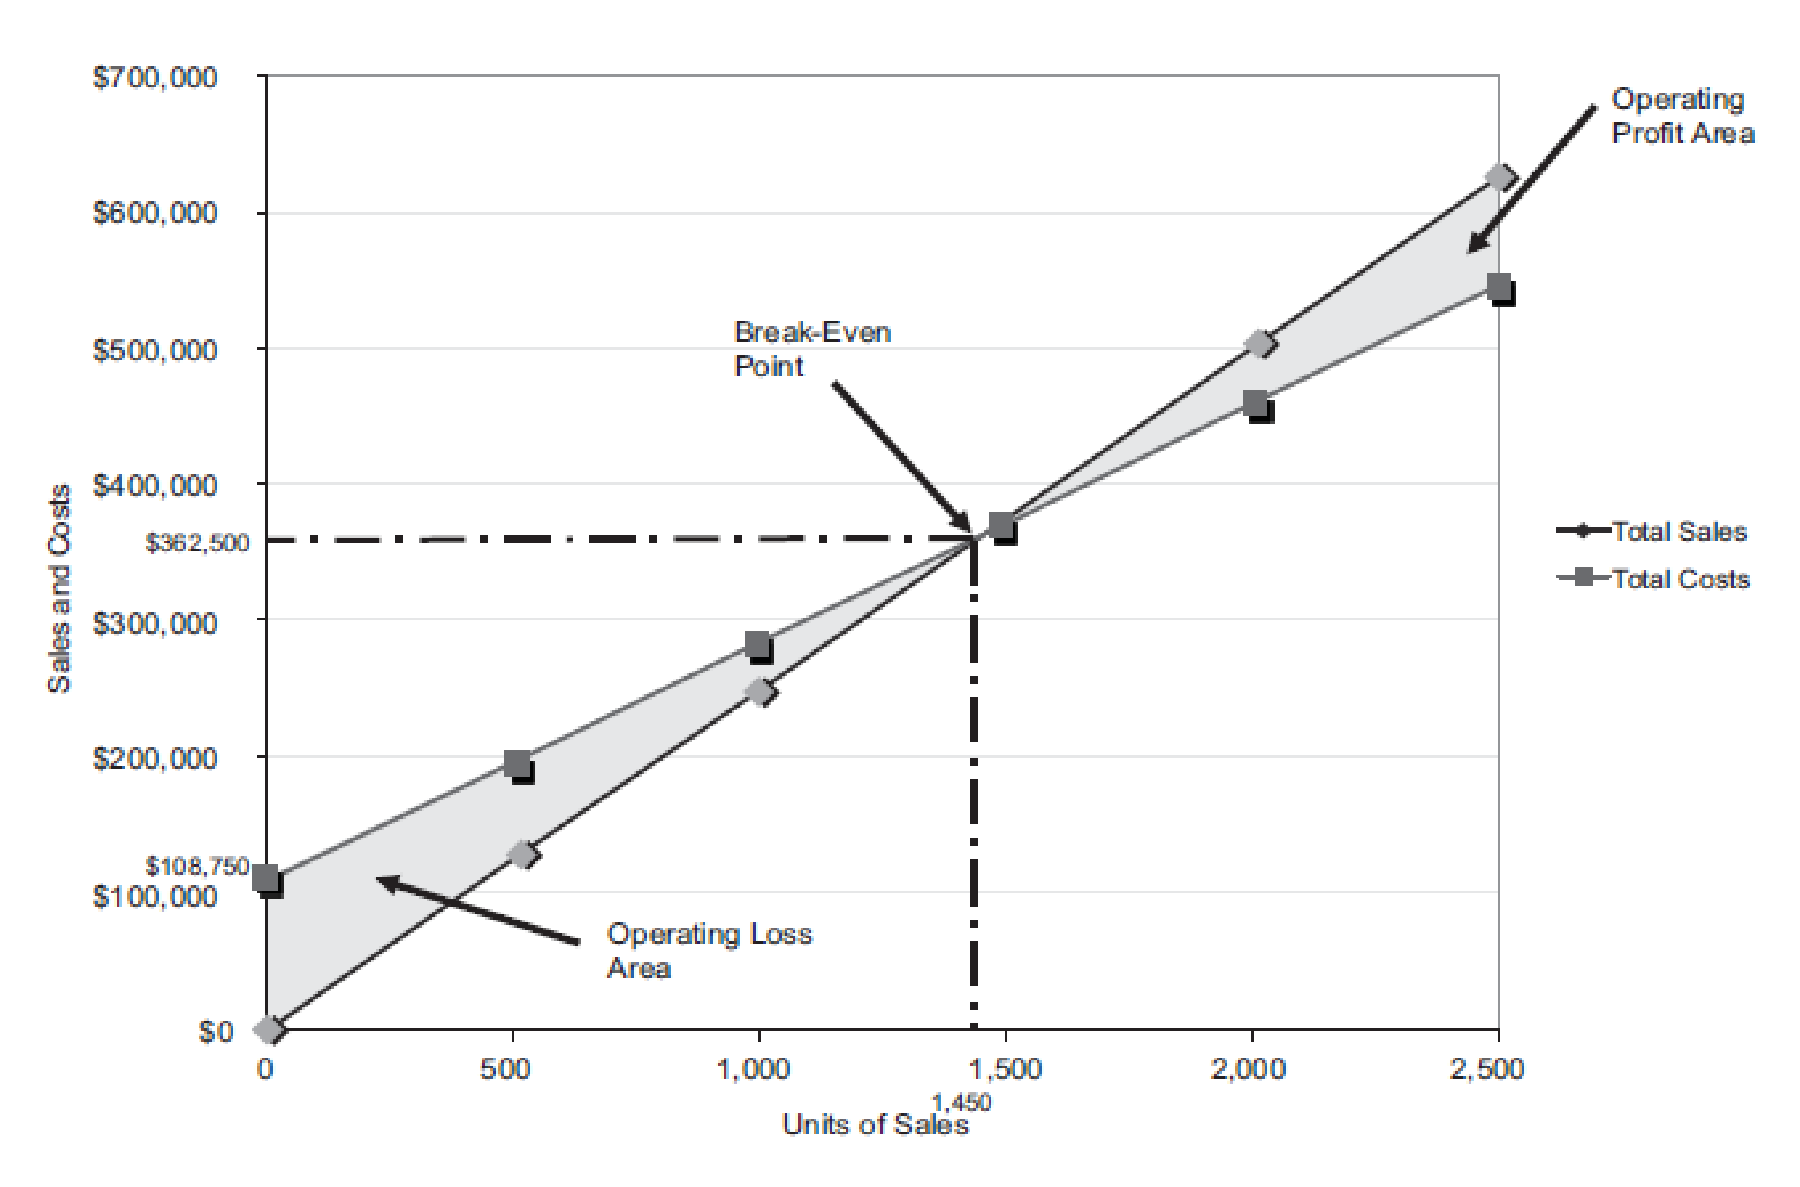
Figure (3)
The volume in units of sales is shown on the horizontal axis. The maximum relevant range is 2,500 units. The sales and the total costs (fixed cost and variable cost) in dollars is shown on the vertical axis. The maximum relevant range of sales and total costs is $700,000.
The total sales line is drawn right upward by connecting the first point at $0 to the second point at $625,000
The total cost line is drawn right upward by connecting the first point at
The break-even point is the intersection point where the total sales line and total cost line meet. The vertical dotted line drawn downward from the intersection point reaches at 1,450 units. It indicates the break-even sales (units). The horizontal line drawn to the left towards the vertical axis reaches at $362,500. It indicates the break-even sales (dollars).
The operating profit area is the area where the total sales line exceeds the total cost line. However, the operating loss area is the area where the total cost exceeds the total sales line.
Verify the answer using the break-even equation as follows:
Determine the break-even sales in units.
Fixed cost =$75,000
Increase in fixed cost (billboard advertising) =$33,750
Contribution margin per unit =$75 per unit (1)
Determine the break-even sales in dollars.
Fixed cost =$75,000
Increase in fixed cost (billboard advertising) =$33,750
Contribution margin ratio =30% (2)
4(A)
Compute the income from operations for sales 2,000 units, and verify the answers using the mathematical approach to cost-volume-profit analysis
4(A)
Explanation of Solution
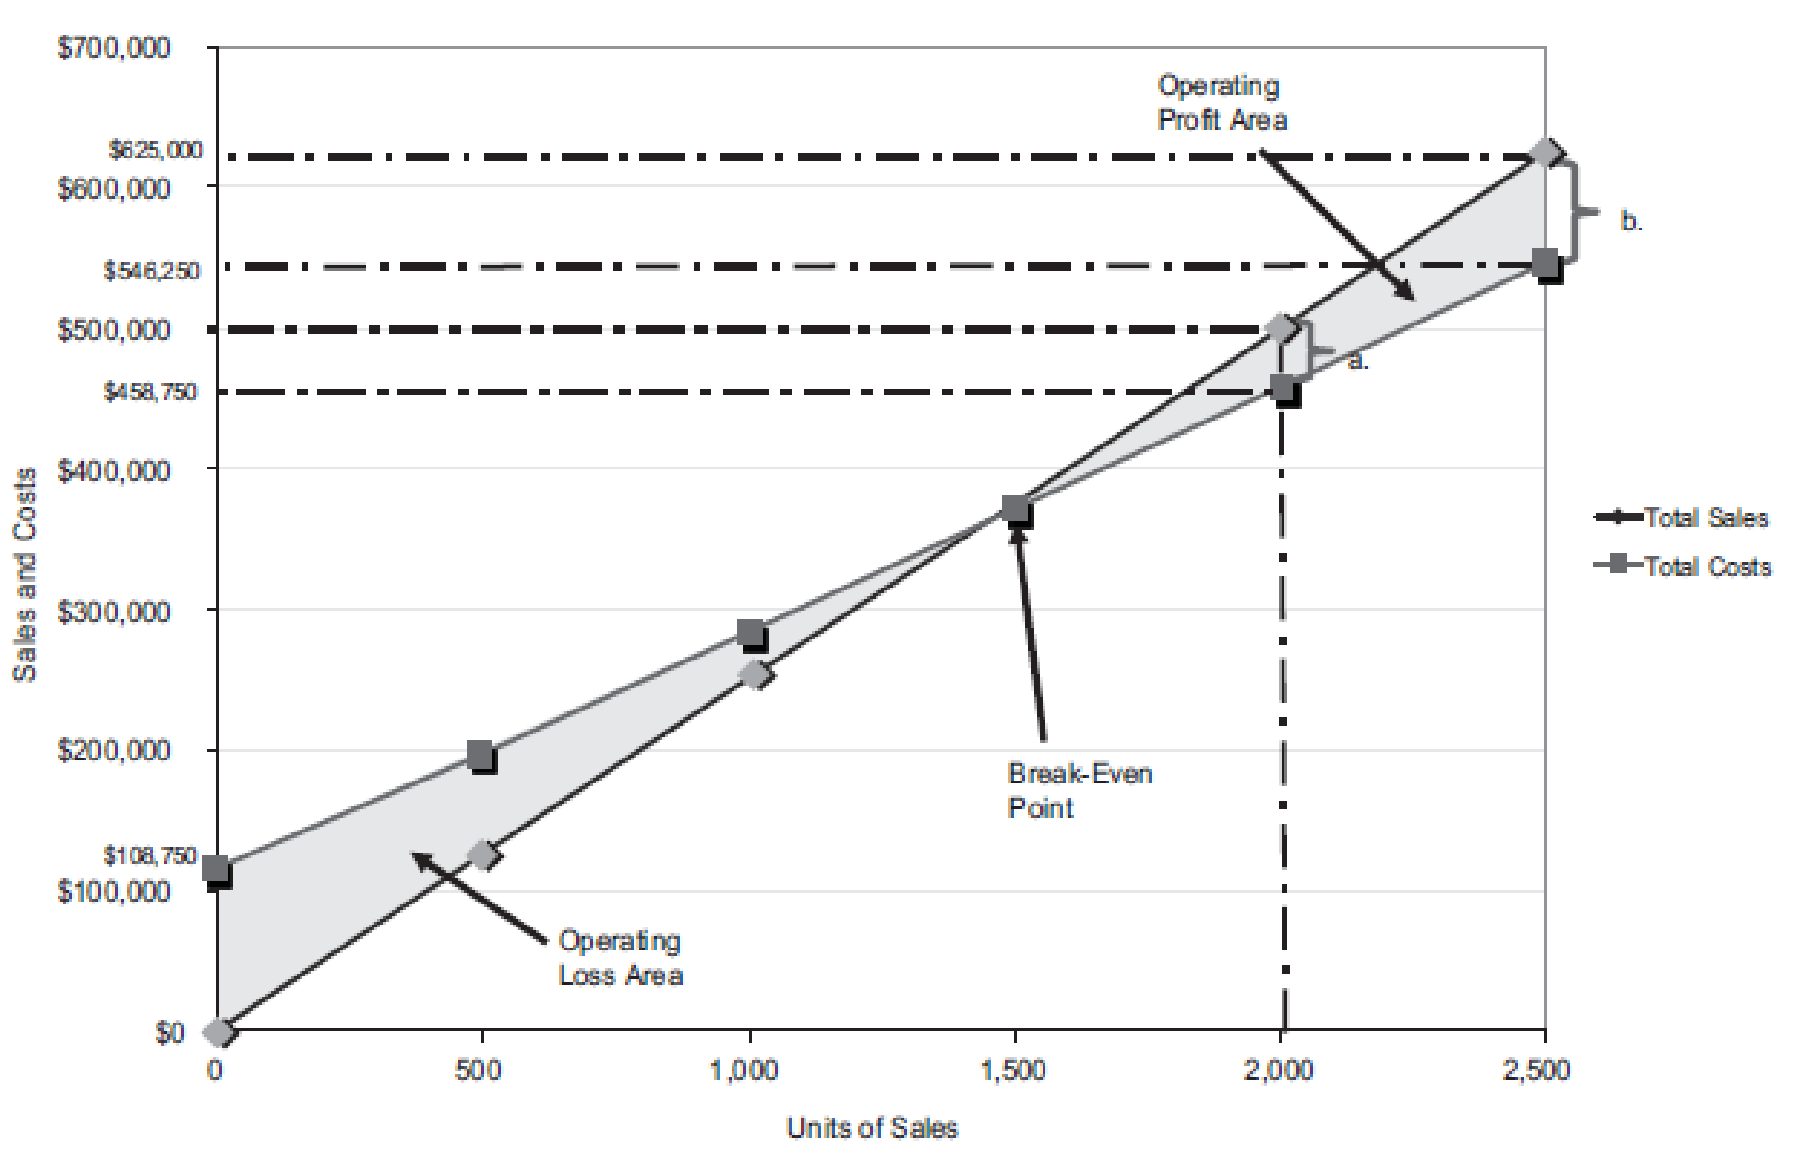
Figure (4)
Last year, the number of units sold is 2,000 units (3). The total sales is $500,000. The total cost is
Similarly, a dotted line is drawn from the total cost at $458,750 on the vertical axis towards the right and a dotted line is drawn upward for the 2,000 units sold from the horizontal axis. The two dotted line meet at a point which indicates the point of total cost at 2,000 units.
The dotted line from sales is above the dotted line for total cost. This indicates the income from operations. Thus, the area in between the two dotted lines is the income from operations of
Verify the answers using the mathematical approach to cost-volume-profit analysis.
Determine the income from operations for the last year.
| Determine the income from operations for 2,000 units | ||
| Particulars | Amount ($) | Amount ($) |
| Sales | 500,000 | |
| Less: Total Fixed costs | 108,750 | |
| Variable costs | 350,000 | (458,750) |
| Income from operations | 41,250 | |
Table (3)
4(B)
Compute the maximum income from operations that could have been realized during the year and verify the answer.
4(B)
Explanation of Solution
The maximum relevant range for number of units to be sold is 2,500 units. Thus, the total sales is
Similarly, a dotted line is drawn from the total cost at $546,250 on the vertical axis towards the right and a dotted line is drawn upward for the 2,500 units sold from the horizontal axis. The two dotted line meet at a point which indicates the point of total cost at 2,500 units.
The dotted line from sales is above the dotted line for total cost. This indicates the income from operations. Thus, the area in between the two dotted lines is the income from operations of
Verification:
| Determine the income from operations for 2,500 units | ||
| Particulars | Amount ($) | Amount ($) |
| Sales | 625,000 | |
| Less: Total Fixed costs | 108,750 | |
| Variable costs | 437,500 | (546,250) |
| Income from operations | 78,750 | |
Table (4)
Want to see more full solutions like this?
Chapter 20 Solutions
FINANCIAL&MANAGERIAL ACCOUNTING(LL)W/AC

- I need the correct answer to this general accounting problem using the standard accounting approach.arrow_forwardYou are employed by an external audit firm that is hired by JBltd, a privately owned incorporated business. Accounting records are maintained on a computer using proprietary software. You have worked on the audit for three years and this year you are in charge of the audit. Your assistant is a newly recruited business graduate who has done an accounting course but has no practical experience. Because of the small size of the company there is limited opportunity for segregation of duties. You decide, as in previous years, that the appropriate audit strategy is to obtain evidence primarily through the performance of substantive procedures. You also plan to perform the audit around the computer as the proprietary software is known to be reliable and details of all transactions and balances can be readily printed out. On arriving at the company's premises in December 2019 to perform the final audit on the 31 October 2019 financial statements, you obtain a copy of the year end bank…arrow_forwardGeneral accountingarrow_forward
 Cornerstones of Cost Management (Cornerstones Ser...AccountingISBN:9781305970663Author:Don R. Hansen, Maryanne M. MowenPublisher:Cengage Learning
 Excel Applications for Accounting PrinciplesAccountingISBN:9781111581565Author:Gaylord N. SmithPublisher:Cengage Learning
 Managerial AccountingAccountingISBN:9781337912020Author:Carl Warren, Ph.d. Cma William B. TaylerPublisher:South-Western College Pub