1.
Construct a cost-volume-profit chart indicating the break-even sales for last year, and verify the answer using the break-even equation.
1.
Explanation of Solution
Cost-Volume-Profit Analysis: It is a method followed to analyze the relationship between the sales, costs, and the related profit or loss at various levels of units sold. In other words, it shows the effect of the changes in the cost and the sales volume on the operating income of the company.
Construct a cost-volume-profit chart indicating the break-even sales for last year.
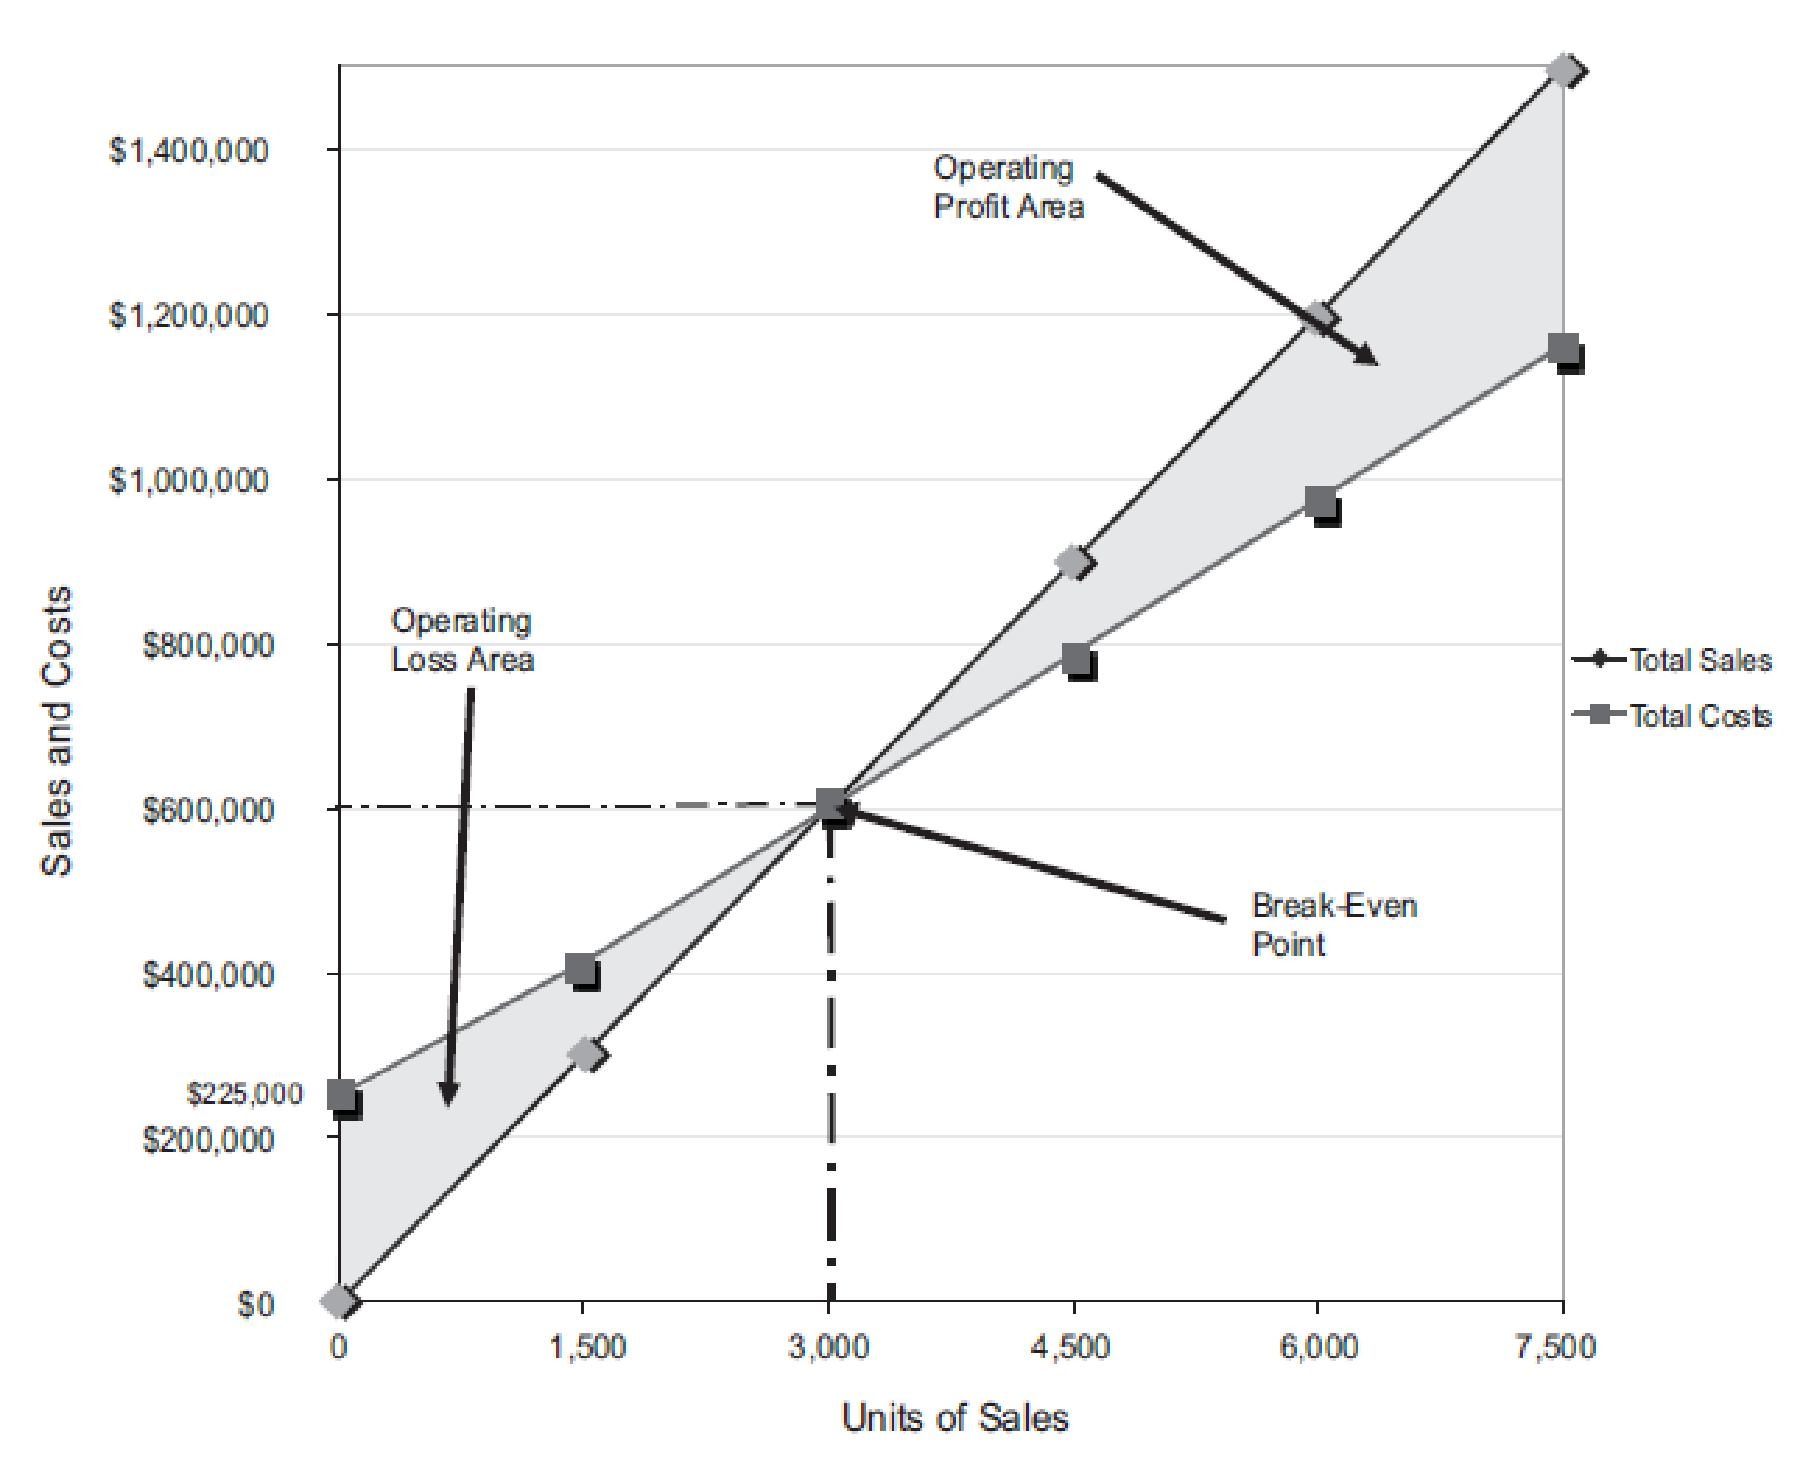
Figure (1)
The volume in units of sales is shown on the horizontal axis. The maximum relevant range is 7,500 units. The sales and the total costs (fixed cost and variable cost) in dollars is shown on the vertical axis. The maximum relevant range of sales and total costs is $1,500,000.
The total sales line is drawn right upward by connecting the first point at $0 to the second point at $1,500,000
The total cost line is drawn right upward by connecting the first point at $225,000 (fixed cost) on the vertical axis to the second point at $1,162,500
The break-even point is the intersection point where the total sales line and total cost line meet. The vertical dotted line drawn downward from the intersection point reaches at 3,000 units. It indicates the break-even sales (units). The horizontal line drawn to the left towards the vertical axis reaches at $600,000. It indicates the break-even sales (dollars).
The operating profit area is the area where the total sales line exceeds the total cost line. However, the operating loss area is the area where the total cost exceeds the total sales line.
Verify the answer using the break-even equation.
Determine the break-even sales in units.
Fixed cost =$225,000
Contribution margin per unit =$75 per unit (1)
Determine the break-even sales in dollars.
Fixed cost =$225,000
Contribution margin ratio =37.5% (2)
Working note (1):
Compute the contribution margin per unit.
Selling price per unit =$200 per unit
Variable cost per unit =$125 per unit
Working note (2):
Determine the contribution margin ratio.
Contribution margin =$75 per unit (1)
Selling price per unit =$200 per unit
2(A)
Compute the income from operations for last year and (B) the maximum income from operations that could have been realized during the year using the cost-volume-profit chart, and verify the answers using the mathematical approach to cost-volume-profit analysis.
2(A)
Explanation of Solution
Determine the income from operations for last year and (B) the maximum income from operations that could have been realized during the year.
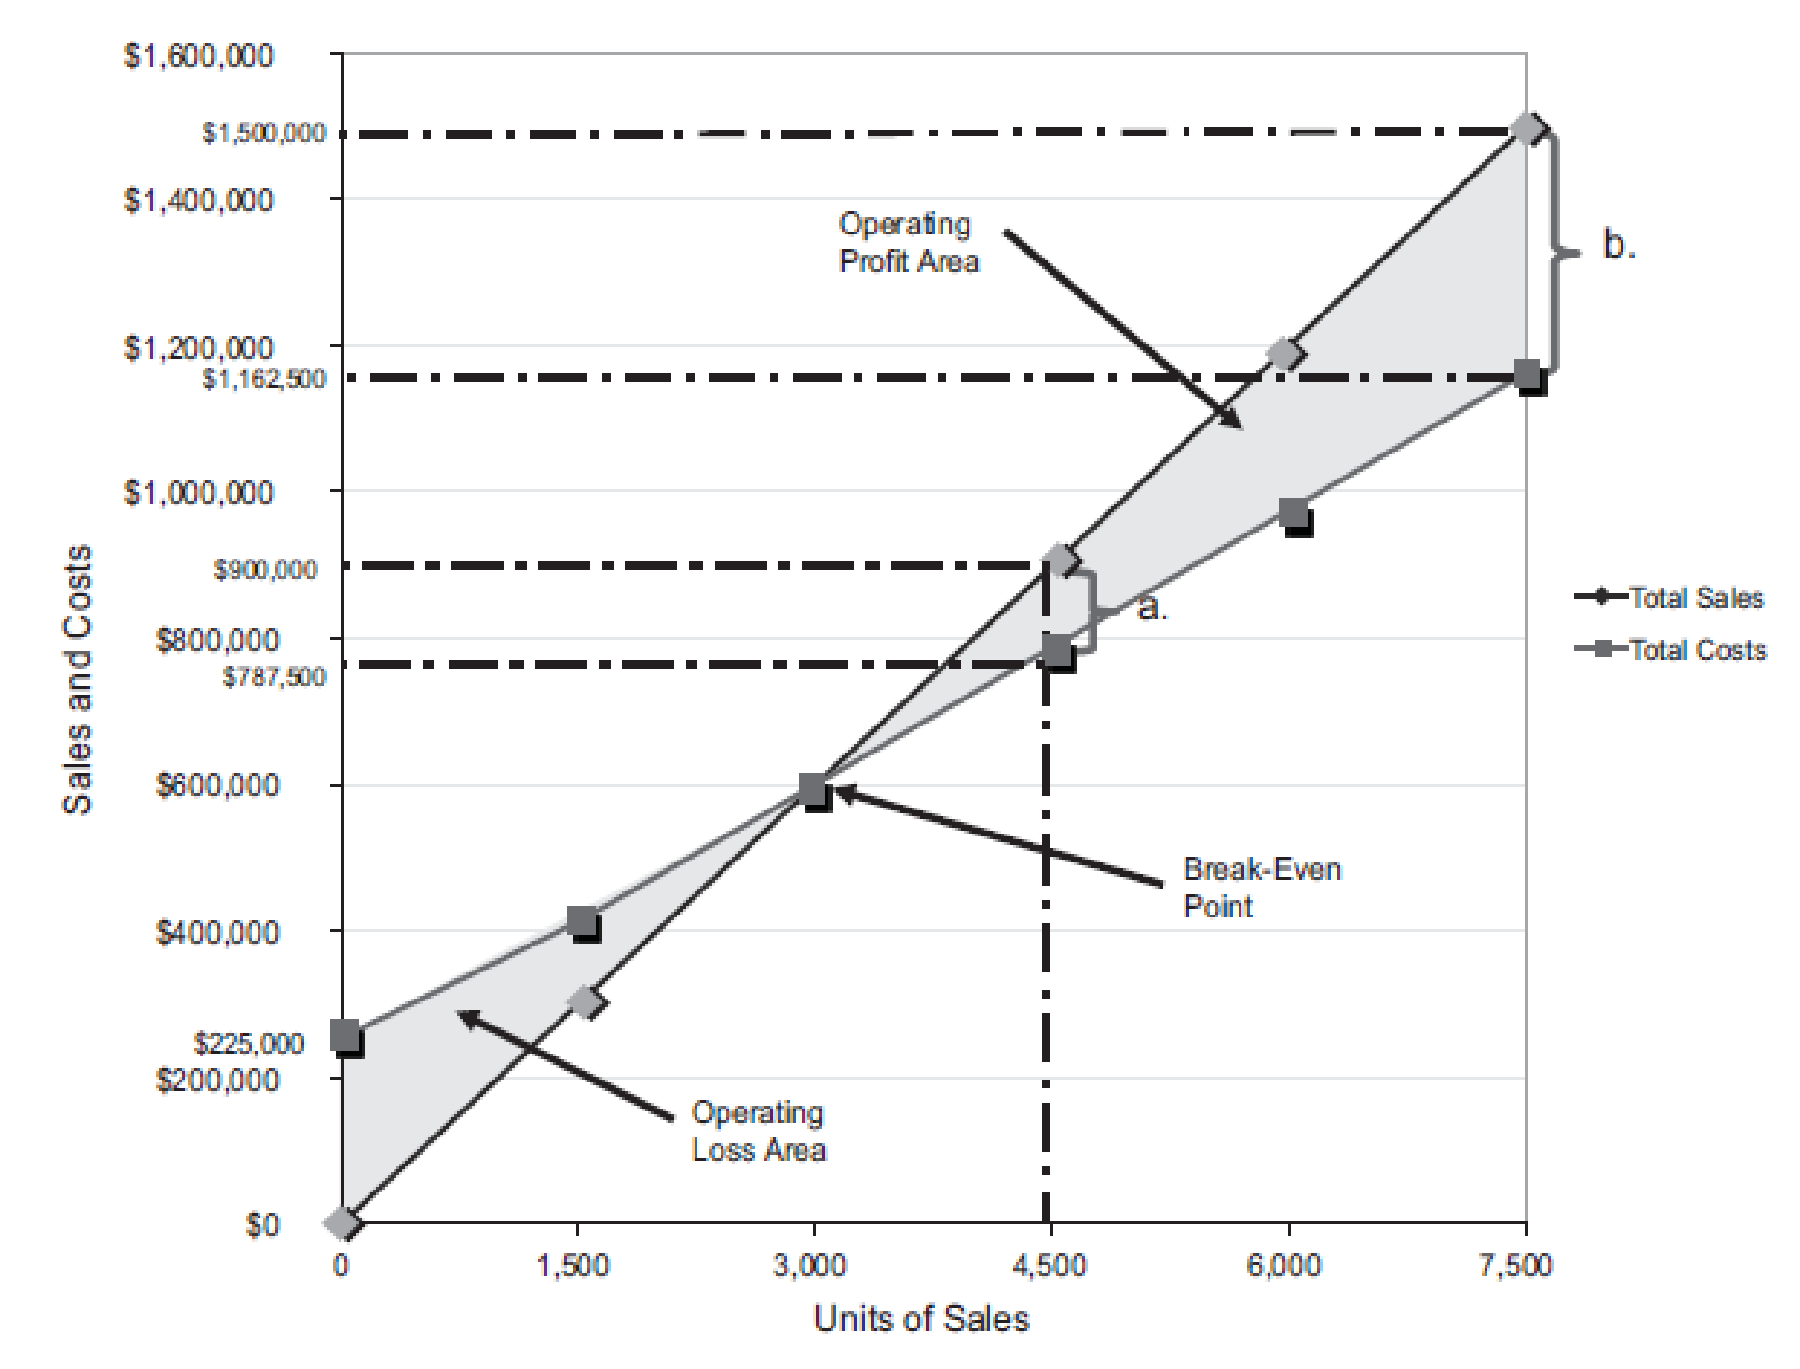
Figure (2)
Last year, the number of units sold is 4,500 units (3). The total sales is $900,000. The total cost is
Similarly, a dotted line is drawn from the total cost at $787,500 on the vertical axis towards the right and a dotted line is drawn upward for the 4,500 units sold from the horizontal axis. The two dotted line meet at a point which indicates the point of total cost at 4,500 units.
The dotted line from sales is above the dotted line for total cost. This indicates the income from operations. Thus, the area in between the two dotted lines is the income from operations of
Verify the answers using the mathematical approach to cost-volume-profit analysis.
Determine the income from operations for the last year.
| Determine the income from operations for 4,500 units | ||
| Particulars | Amount ($) | Amount ($) |
| Sales | 900,000 | |
| Less: Fixed costs | 225,000 | |
| Variable costs | 562,500 | (787,500) |
| Income from operations | 112,500 | |
Table (1)
Working note (3):
Determine the number of units sold.
Sales =$900,000
Selling price per unit =$200 per unit
2(B)
Compute the maximum income from operations realized during the year, and verify the answer.
2(B)
Explanation of Solution
The maximum relevant range for number of units to be sold is 7,500 units. Thus, the total sales is
Similarly, a dotted line is drawn from the total cost at $1,162,500 on the vertical axis towards the right and a dotted line is drawn upward for the 7,500 units sold from the horizontal axis. The two dotted line meet at a point which indicates the point of total cost at 7,500 units.
The dotted line from sales is above the dotted line for total cost. This indicates the income from operations. Thus, the area in between the two dotted lines is the income from operations of
Verification:
Compute the maximum income from operations that could have been realized during the year.
| Determine the income from operations for 7,500 units | ||
| Particulars | Amount ($) | Amount ($) |
| Sales | 1,500,000 | |
| Less: Fixed costs | 225,000 | |
| Variable costs | 937,500 | (1,162,500) |
| Income from operations | 337,500 | |
Table (2)
3.
Construct a cost-volume-profit chart indicating the break-even sales for the current year, verify the answer using the break-even equation.
3.
Explanation of Solution
Construct a cost-volume-profit chart indicating the break-even sales for the current year.
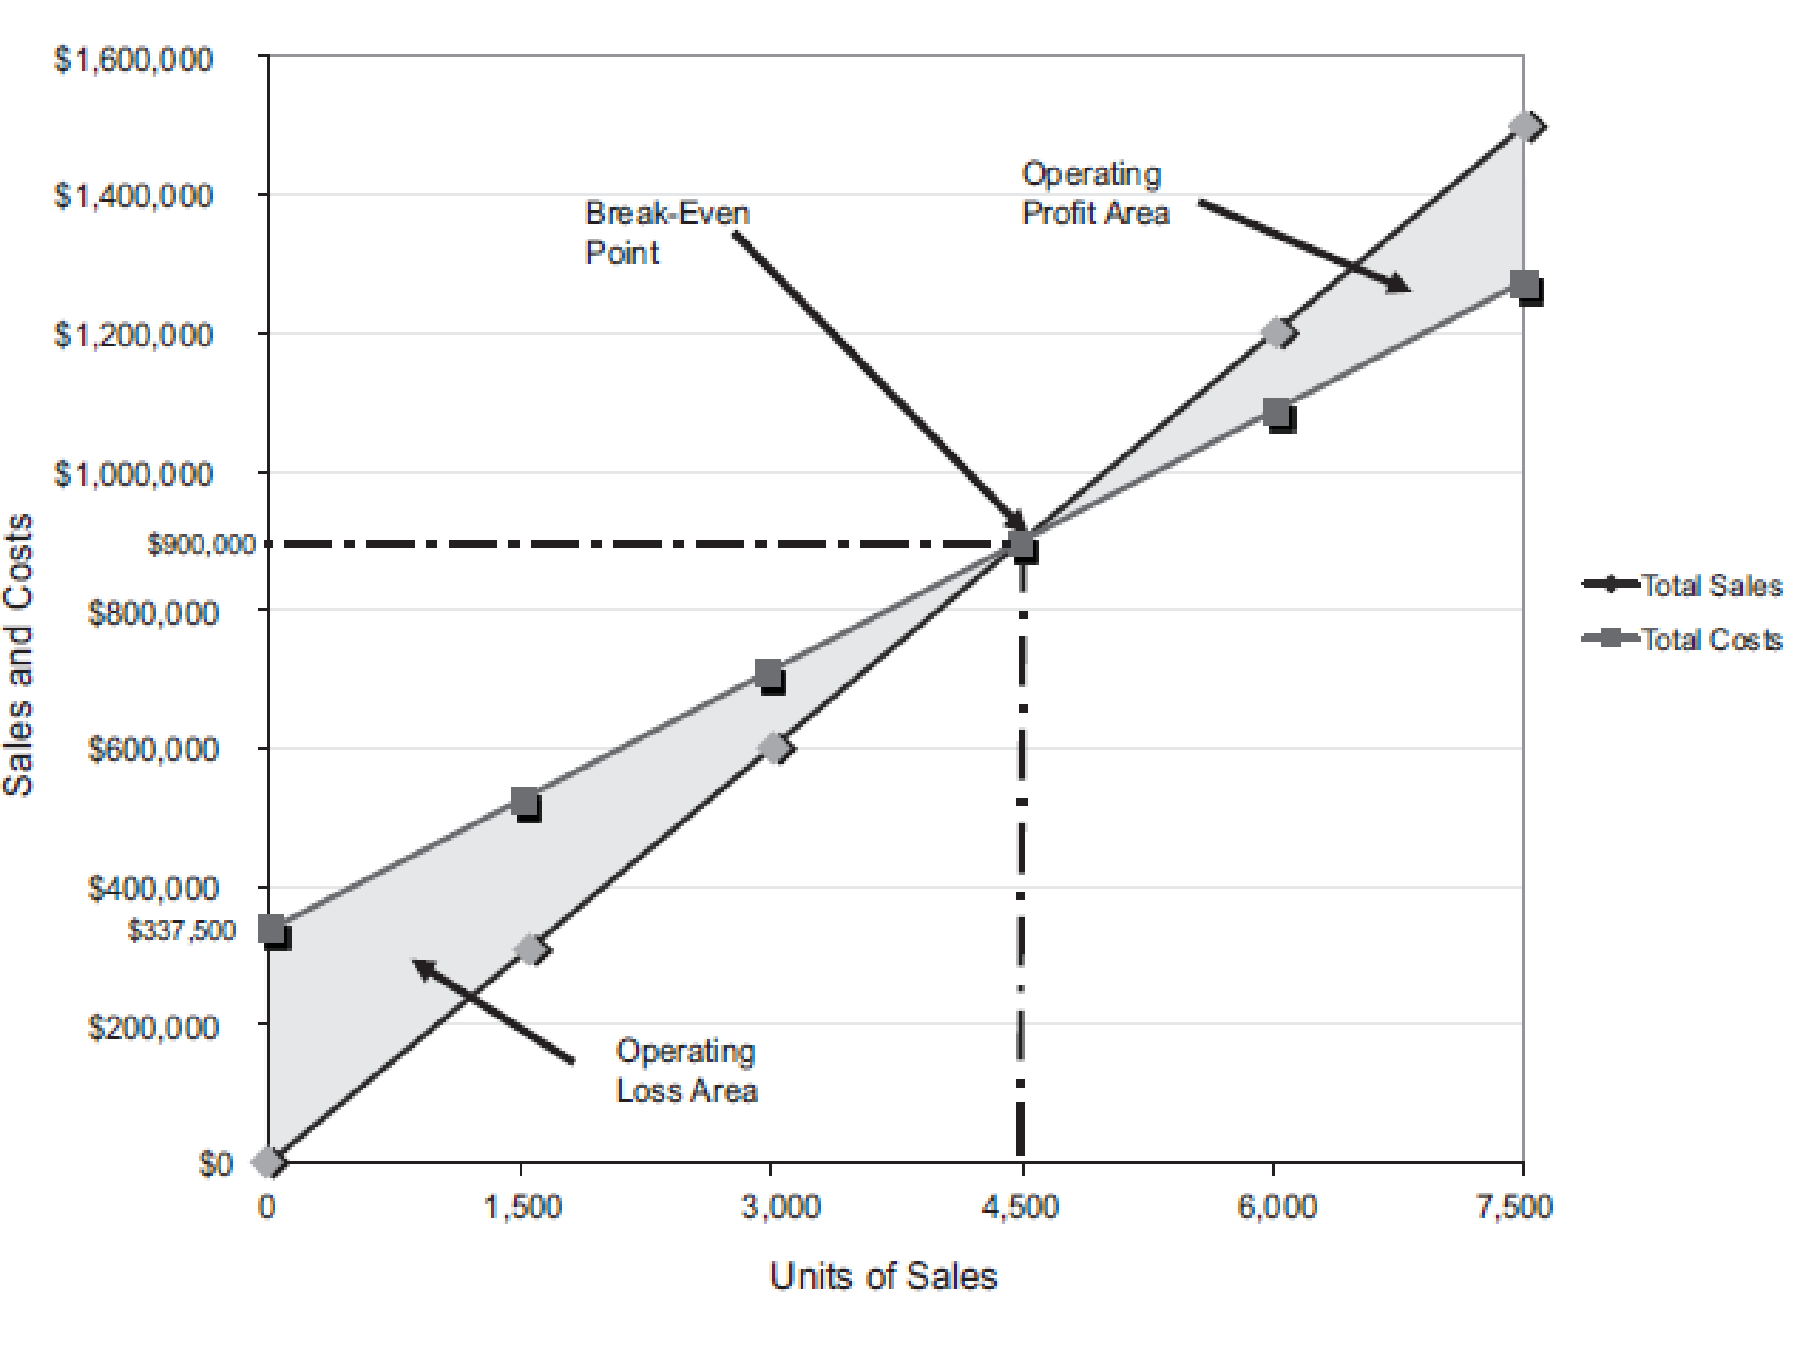
Figure (3)
The volume in units of sales is shown on the horizontal axis. The maximum relevant range is 7,500 units. The sales and the total costs (fixed cost and variable cost) in dollars is shown on the vertical axis. The maximum relevant range of sales and total costs is $1,600,000.
The total sales line is drawn right upward by connecting the first point at $0 to the second point at $900,000
The total cost line is drawn right upward by connecting the first point at
The break-even point is the intersection point where the total sales line and total cost line meet. The vertical dotted line drawn downward from the intersection point reaches at 4,500 units. It indicates the break-even sales (units). The horizontal line drawn to the left towards the vertical axis reaches at $900,000. It indicates the break-even sales (dollars).
The operating profit area is the area where the total sales line exceeds the total cost line. However, the operating loss area is the area where the total cost exceeds the total sales line.
Verify the answer using the break-even equation.
Determine the break-even sales in units.
Fixed cost =$225,000
Increase in fixed cost (billboard advertising) =$112,500
Contribution margin per unit =$75 per unit (1)
Determine the break-even sales in dollars.
Fixed cost =$225,000
Increase in fixed cost (billboard advertising) =$112,500
Contribution margin ratio =37.5% (2)
4(A)
Compute the income from operations for sales 6,000 units and (B) the maximum income from operations that could have been realized during the year using the cost-volume-profit chart, and verify the answer.
4(A)
Explanation of Solution
Determine (A) the income from operations for sales 6,000 units and (B) the maximum income from operations that could have been realized during the year.
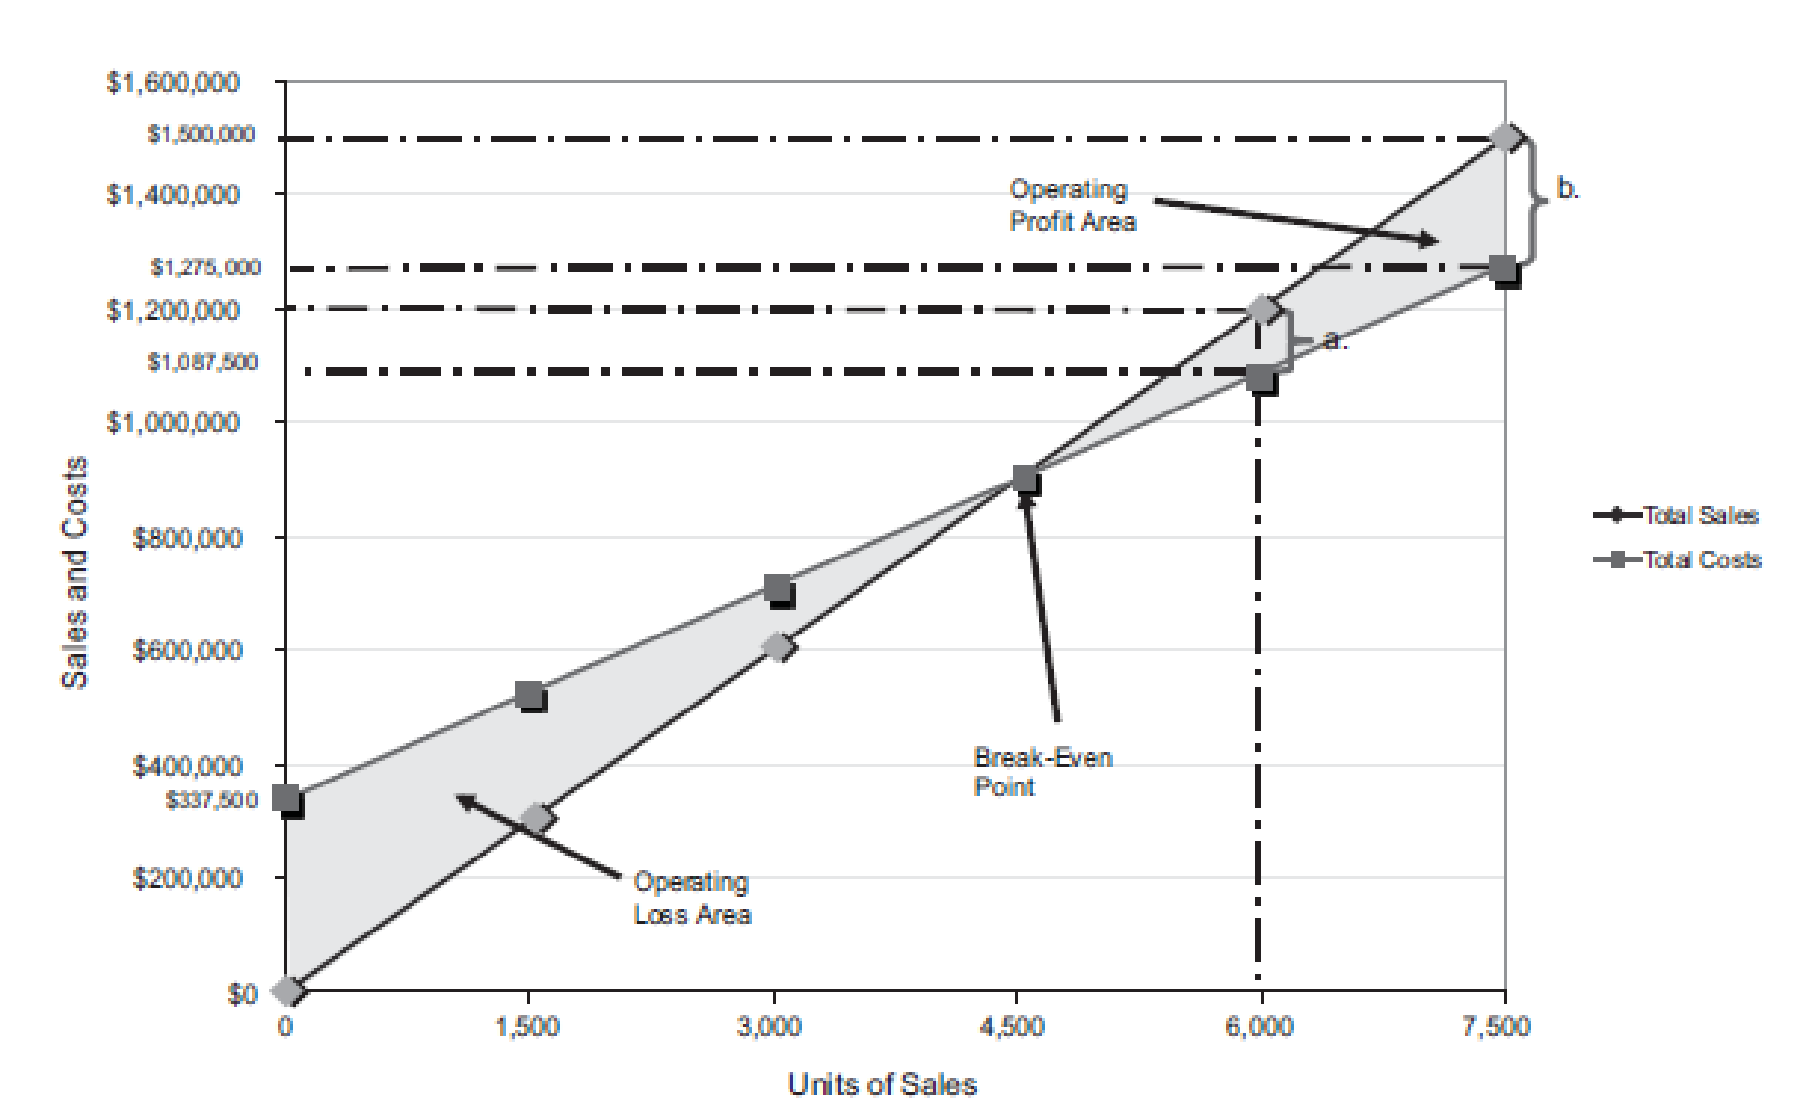
Figure (4)
The number of units sold is 6,000 units. The total sales is
Similarly, a dotted line is drawn from the total cost at $1,087,500 on the vertical axis towards the right and a dotted line is drawn upward for the 6,000 units sold from the horizontal axis. The two dotted line meet at a point which indicates the point of total cost at 6,000 units.
The dotted line from sales is above the dotted line for total cost. This indicates the income from operations. Thus, the area in between the two dotted lines is the income from operations of
Verification:
Determine the income from operations for the last year.
| Determine the income from operations for 6,000 units | ||
| Particulars | Amount ($) | Amount ($) |
| Sales | 1,200,000 | |
| Less: Total Fixed costs | 337,500 | |
| Variable costs | 750,000 | (1,087,500) |
| Income from operations | 112,500 | |
Table (3)
4(B)
Compute the maximum income from operations that could have been realized during the year and verify the answer.
4(B)
Explanation of Solution
The maximum relevant range for number of units to be sold is 7,500 units. Thus, the total sales is
Similarly, a dotted line is drawn from the total cost at $1,275,000 on the vertical axis towards the right and a dotted line is drawn upward for the 7,500 units sold from the horizontal axis. The two dotted line meet at a point which indicates the point of total cost at 7,500 units.
The dotted line from sales is above the dotted line for total cost. This indicates the income from operations. Thus, the area in between the two dotted lines is the income from operations of
Verification:
Determine the maximum income from operations that could have been realized during the year.
| Determine the income from operations for 7,500 units | ||
| Particulars | Amount ($) | Amount ($) |
| Sales | 1,500,000 | |
| Less: Total Fixed costs | 337,500 | |
| Variable costs | 937,500 | (1,275,000) |
| Income from operations | 225,000 | |
Table (4)
Want to see more full solutions like this?
Chapter 20 Solutions
Financial and Managerial Accounting - CengageNow

- Expert need your helparrow_forwardI need assistance with this financial accounting question using appropriate principles.arrow_forwardHorngren's Financial & Managerial Accounting: The Managerial Chapters, 8th Edition. E-M:9-16 Using responsibility reports to evaluate cost, revenue, and profit centers The accountant for a subunit of Bellamy Sports Company went on vacation before completing the subunit’s monthly responsibility report. This is as far as she got: Subunit X Revenue by Product Actual Results Flexible Budget Variance F or U Flexible Budget Sales Volume Variance F or U Static Budget Downhill-RI $ 326,000 (a) (b) $ 19,000 F $ 301,000 Downhill-RII $ 154,000 (c) $ 164,000 (d) $ 148,000 Cross-EXI $ 280,000 $ 1,000 U $ 281,000 (e) $ 297,000 Cross-EXII $ 254,000 (f) $ 249,000 $ 16,500 U $ 265,500 Snow-LXI $ 424,000 $ 2,000 F (g) (h) $…arrow_forward
- Can you explain the process for solving this financial accounting problem using valid standards?arrow_forwardI need guidance with this general accounting problem using the right accounting principles.arrow_forwardI am trying to find the accurate solution to this general accounting problem with appropriate explanations.arrow_forward
 Cornerstones of Cost Management (Cornerstones Ser...AccountingISBN:9781305970663Author:Don R. Hansen, Maryanne M. MowenPublisher:Cengage Learning
 Excel Applications for Accounting PrinciplesAccountingISBN:9781111581565Author:Gaylord N. SmithPublisher:Cengage Learning