From the data in problem 20-3, if the price of cheeseburger is $2, the price of a bag of French fries is $1, and you have $6 to spend (and you spend all of it), what is the utility maximizing combination of cheeseburgers and French fries?
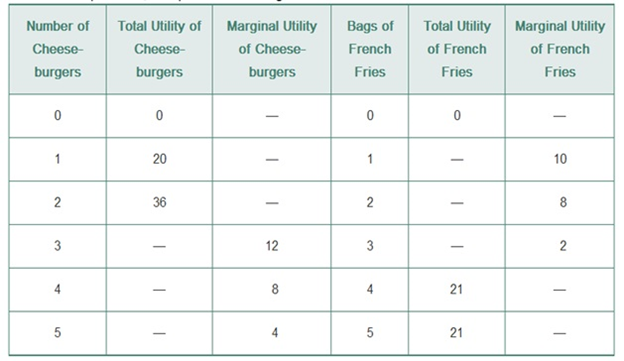
20-3 Where possible, complete the missing cells in the table below.
Concept Introduction:
Consumer Equilibrium condition: It states that the
Total Utility= It is the numerical value assigned to the level of satisfaction derived from consumption of all goods or services.
Marginal Utility= It is the numerical value assigned to the level of satisfaction derived from consumption of additional good or service.
| Number of Cheese-burgers | Total Utility of Cheese-burgers | Marginal Utility of Cheese-burgers | Money spent | Bags of French Fries | Total Utility of French Fries | Marginal utility of French Fries | Money spent | |
| 0 | 0 | 0 | 0 | 0 | 0 | |||
| 1 | 20 | 20 | $2 | 1 | 10 | 10 | $1 | |
| 2 | 36 | 16 | $2 | 2 | 18 | 8 | $1 | |
| 3 | 48 | 12 | 3 | 20 | 2 | |||
| 4 | 56 | 8 | 4 | 21 | 1 | |||
| 5 | 60 | 4 | 5 | 21 | 0 |
$1 on the1st bag of French fries
$1 on the 2nd bag of French fries
$2 on the 1st cheeseburger
$2 on the 2nd cheeseburger
Want to see the full answer?
Check out a sample textbook solution
Chapter 20 Solutions
Economics Today: The Micro View (18th Edition)

- Where can I go to get my own wax supplies?arrow_forwardProblem 2. If the consumer preference can be represented by a CES function with δ = 0.5, i.e. u(x, y) = x0.5 + y0.5. Let the prices and income be (px, py, w). 1. Set up the Lagrangian expression.2. Take the first-order conditions.3. Substitute into budget constraint to derive the optimal consumption bundles.arrow_forward1. A town relies on four different sources for its non-drinking water needs: dam water, reclaimed water, rain water, and desalinated water. The different sources carry different risks and costs. For instance, desalinated water is fully reliable due to abundant sea water, but it is more expensive than other options. Reclaimed water also has relatively lower risk than rain or dam water since a certain amount can be obtained, even during the dry. season, by the treatment of daily generated waste water. Using any of the four options requires an investment in that resource. The return on a particular water source is defined as the amount of water generated by the source per dollar of investment in it. The expected returns and standard deviations of those returns for the four water sources are described in the following table: Water resource Expected return St. Deviation Dam water 2.7481 0.2732 Reclaimed water 1.6005 0.0330 Rain water 0.5477 0.2865 Desalinated water 0.3277 0.0000 Higher…arrow_forward
- 1. Imagine a society that produces military goods and consumer goods, which we'll call "guns" and "butter." a. Draw a production possibilities frontier for guns and butter. Using the concept of opportunity cost, explain why it most likely has a bowed-out shape. b. Show a point that is impossible for the economy to achieve. Show a point that is feasible but inefficient. c. Imagine that the society has two political parties, called the Hawks (who want a strong military) and the Doves (who want a smaller military). Show a point on your production possibilities frontier that the Hawks might choose and a point the Doves might choose. d. Imagine that an aggressive neighboring country reduces the size of its military. As a result, both the Hawks and the Doves reduce their desired production of guns by the same amount. Which party would get the bigger "peace dividend," measured by the increase in butter production? Explain.arrow_forwardA health study tracked a group of persons for five years. At the beginning of the study, 20%were classified as heavy smokers, 30% as light smokers, and 50% as nonsmokers. Resultsof the study showed that light smokers were twice as likely as nonsmokers to die duringthe five-year study, but only half as likely as heavy smokers.A randomly selected participant from the study died during the five-year period. Calculatethe probability that the participant was a heavy smokerarrow_forwardConsider two assets with the following returns: State Prob. of state R₁ R2 1 23 13 25% 5% 2 -10% 1% Compute the optimal portfolio for an investor having a Bernoulli utility of net returns u(r) = 2√√r+ 10. Compute the certainty equivalent of the optimal portfolio. Do the results change if short-selling is not allowed? If so, how?arrow_forward
- In the graph at the right, the average variable cost is curve ☐. The average total cost is curve marginal cost is curve The C Cost per Unit ($) Per Unit Costs A 0 Output Quantity Barrow_forwardWhat are some of the question s that I can ask my economic teacher?arrow_forwardAnswer question 2 only.arrow_forward
- 1. A pension fund manager is considering three mutual funds. The first is a stock fund, the second is a long-term government and corporate fund, and the third is a (riskless) T-bill money market fund that yields a rate of 8%. The probability distributions of the risky funds have the following characteristics: Standard Deviation (%) Expected return (%) Stock fund (Rs) 20 30 Bond fund (RB) 12 15 The correlation between the fund returns is .10.arrow_forwardFrederick Jones operates a sole proprietorship business in Trinidad and Tobago. His gross annual revenue in 2023 was $2,000,000. He wants to register for VAT, but he is unsure of what VAT entails, the requirements for registration and what he needs to do to ensure that he is fully compliant with VAT regulations. Make reference to the Vat Act of Trinidad and Tobago and explain to Mr. Jones what VAT entails, the requirements for registration and the requirements to be fully compliant with VAT regulations.arrow_forwardCan you show me the answers for parts a and b? Thanks.arrow_forward

 Principles of Economics (12th Edition)EconomicsISBN:9780134078779Author:Karl E. Case, Ray C. Fair, Sharon E. OsterPublisher:PEARSON
 Engineering Economy (17th Edition)EconomicsISBN:9780134870069Author:William G. Sullivan, Elin M. Wicks, C. Patrick KoellingPublisher:PEARSON
 Principles of Economics (MindTap Course List)EconomicsISBN:9781305585126Author:N. Gregory MankiwPublisher:Cengage Learning
 Managerial Economics: A Problem Solving ApproachEconomicsISBN:9781337106665Author:Luke M. Froeb, Brian T. McCann, Michael R. Ward, Mike ShorPublisher:Cengage Learning
 Managerial Economics & Business Strategy (Mcgraw-...EconomicsISBN:9781259290619Author:Michael Baye, Jeff PrincePublisher:McGraw-Hill Education