Subpart (a):
Long run equilibrium in AD-AS model.
Subpart (a):
Explanation of Solution
The supply depends upon the
The
The equilibrium is a condition where the aggregate demand curve of the economy intersects with the aggregate supply curve of the economy. Then there will be an equilibrium point derived where the economy will be in its equilibrium without any excess demand or supply. The quantity on the X axis will represent the
Concept introduction:
Aggregate demand curve: It is the curve which shows the relationship between the price level in the economy and the quantity of real GDP demanded by the economic agents such as the households, firms as well as the government.
Equilibrium: The equilibrium in the economy is the point where the economy's aggregate demand curve and the aggregate supply curve intersects with each other. There will be no excess demand or
Subpart (b):
Long run equilibrium in AD-AS model.
Subpart (b):
Explanation of Solution
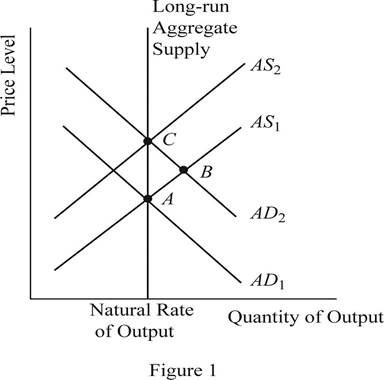
When the money supply of the economy increases with the intervention of the Central Bank of the economy, the money with the public will increase. When the money with the public increases, they will feel wealthier and as a result they will demand more consumer goods and services. As a result, the aggregate demand of the economy increases and it will shift the AD curve towards the right. This can be identified as the change to the equilibrium point B as shown in Figure 1. Thus, in short, the increase in the money supply leads to the increase in the output and price level of the economy.
Concept introduction:
Aggregate demand curve: It is the curve which shows the relationship between the price level in the economy and the quantity of real GDP demanded by the economic agents such as the households, firms as well as the government.
Aggregate supply curve: In the short run, it is a curve which shows the relationship between the price level in the economy and the supply in the economy by the firms. In the long run, it shows the relationship between the price level and the level of quantity supplied by the firms.
Equilibrium: The equilibrium in the economy is the point where the economy's aggregate demand curve and the aggregate supply curve intersects with each other. There will be no excess demand or excess supply in the economy at the equilibrium.
Subpart (c):
Long run equilibrium in AD-AS model.
Subpart (c):
Explanation of Solution
When the AD curve shifts towards the right and increases the output and the price level in the short run, over time, the nominal wages, prices as well as the perceptions and expectations of the economy would adjust to the new equilibrium level. As a result of this gradual adjustment, the cost of production will increase and the result will be a leftward shift in the aggregate supply curve of the economy. Then the economy will return to its natural level of output at a higher price level of the economy. This can be identified as the movement from point B to point C in the graph shown above.
Concept introduction:
Aggregate demand curve: It is the curve which shows the relationship between the price level in the economy and the quantity of real GDP demanded by the economic agents such as the households, firms as well as the government.
Aggregate supply curve: In the short run, it is a curve which shows the relationship between the price level in the economy and the supply in the economy by the firms. In the long run, it shows the relationship between the price level and the level of quantity supplied by the firms.
Equilibrium: The equilibrium in the economy is the point where the economy's aggregate demand curve and the aggregate supply curve intersects with each other. There will be no excess demand or excess supply in the economy at the equilibrium.
Subpart (d):
Long run equilibrium in AD-AS model.
Subpart (d):
Explanation of Solution
The sticky wages theory suggests that when there is inflation in the economy, the wage rate will adjust very slowly to the inflation. More or less the wage rates will be sticky and the main reason will be the long term contracts between the employer and the employees. Thus, in the short run equilibriums such as point A and point B, the wages of the economy would be more or less equal to each other. Whereas the point C represents the long run equilibrium and thus, the wages at the point C will be higher than that in point A and B.
Concept introduction:
Aggregate demand curve: It is the curve which shows the relationship between the price level in the economy and the quantity of real GDP demanded by the economic agents such as the households, firms as well as the government.
Aggregate supply curve: In the short run, it is a curve which shows the relationship between the price level in the economy and the supply in the economy by the firms. In the long run, it shows the relationship between the price level and the level of quantity supplied by the firms.
Equilibrium: The equilibrium in the economy is the point where the economy's aggregate demand curve and the aggregate supply curve intersects with each other. There will be no excess demand or excess supply in the economy at the equilibrium.
Subpart (e):
Long run equilibrium in AD-AS model.
Subpart (e):
Explanation of Solution
The sticky wages theory suggests that when there is inflation in the economy, the wage rate will adjust very slowly to the inflation. More or less, the wage rates will be sticky and the main reason will be the long term contracts between the employer and the employees. So, the nominal wages at equilibrium point A and B will be same. But the increase in the general price level in the economy would reduce the real wages of the workers because, the real wage is the nominal wage divided by the price level. When the denominator increases, it will reduce the value of the real wages in the economy.
Concept introduction:
Aggregate demand curve: It is the curve which shows the relationship between the price level in the economy and the quantity of real GDP demanded by the economic agents such as the households, firms as well as the government.
Aggregate supply curve: In the short run, it is a curve which shows the relationship between the price level in the economy and the supply in the economy by the firms. In the long run, it shows the relationship between the price level and the level of quantity supplied by the firms.
Equilibrium: The equilibrium in the economy is the point where the economy's aggregate demand curve and the aggregate supply curve intersects with each other. There will be no excess demand or excess supply in the economy at the equilibrium.
Sub part (f):
Long run equilibrium in AD-AS model.
Sub part (f):
Explanation of Solution
When the increase in the money supply happens in the economy, it will lead to the increase in the nominal wages as well as the price level in the economy in the long run. As a result of the increase in the nominal wage rate along with the price level in the economy, the real wage rate of the economy would remain unchanged. Thus, the neutrality of money applies in the long run equilibrium.
Concept introduction:
Aggregate demand curve: It is the curve which shows the relationship between the price level in the economy and the quantity of real GDP demanded by the economic agents such as the households, firms as well as the government.
Aggregate supply curve: In the short run, it is a curve which shows the relationship between the price level in the economy and the supply in the economy by the firms. In the long run, it shows the relationship between the price level and the level of quantity supplied by the firms.
Equilibrium: The equilibrium in the economy is the point where the economy's aggregate demand curve and the aggregate supply curve intersects with each other. There will be no excess demand or excess supply in the economy at the equilibrium.
Want to see more full solutions like this?
Chapter 20 Solutions
MANKIW: PRINCIPLES OF MACROECONOMICS

- 3 Producer Surplus, PS $12 $11 S Book Print rences Legend ●Demand ● Supply Price $10 $9 $8 $7 $6 D $5 0 1 2 3 4 5 6 7 8 00 Tons of Wheat (in thousands) 9 10 a. Indicate the consumer surplus if the market is in equilibrium. Instructions: Use the tool provided "Consumer Surplus, CS" to shade in the consumer surplus area on the graph. b. Indicate the producer surplus if the market is in equilibrium. Instructions: Use the tool provided "Producer Surplus, PS" to shade in the producer surplus area on the graph.arrow_forwardFigure 4-4 PRICE a P B Q a QUANTITY Supply Refer to Figure 4-4. The movement from point A to point B on the graph is called a decrease in supply. an increase in supply. an increase in the quantity supplied. a decrease in the quantity supplied. tv all A 18arrow_forwardnot use ai pleasearrow_forward
- answer both question in the picture below swteo by step and give right answer please and explainarrow_forwardnot use ai pleasearrow_forwardA linear programming computer package is needed. As part of the settlement for a class action lawsuit, Hoxworth Corporation must provide sufficient cash to make the following annual payments (in thousands of dollars). 6 Year 1 23. 4 Payment 160 185 210 255 285 430 The annual payments must be made at the beginning of each year. The judge will approve an amount that, along with earnings on its investment, will cover the annual payments. Investment of the funds will be limited to savings (at 4% annually) and government securities, at prices and rates currently quoted in The Wall Street Journal. Hoxworth wants to develop a plan for making the annual payments by investing in the following securities (par value = $1,000). Funds not invested in these securities will be placed in savings. Security Current Price 1 $1,055 Rate (%) Years to Maturity 6.750 3 2 $1,000 5.125 Assume that interest is paid annually. The plan will be submitted to the judge and, if approved, Hoxworth will be required to…arrow_forward
- Put the sections of Cornell notes in the order of completion.arrow_forwardagree or disagree with the post Hi Class! Egyptian dates are much sweeter! Due largely to their climate and geography, Egypt, Saudi Arabia, Algeria, and Iran produce more dates than either the US or Canada. Dates grow best in hot dry climates with long dry growing seasons, which these nations naturally offer. They also produce a lot of dates because of their extensive agricultural, infrastructure, and centuries-old date-growing expertise. Conversely, the U.S., there aren't many places in Canada and California that are suitable for date farming, only a select few, like the Coachella Valley, in California can produce dates on a large scale. Although California produces some dates, it is not as much as countries like Saudi Arabia and Egypt. Depending only on U.S., because of increased labor and production costs, dates grown in this way may have a limited supply and raise prices. We can obtain a greater supply of dates at competitive prices while maintaining consistent quality by…arrow_forwardIn 1932 babe Ruth made $75,000. How much is that in todays dollars please give the right answer step by steparrow_forward
- Evaluate machine XYZ when MARR is 12% per year. Pertinent data are as follows: Machine XYZ Investment cost Expected life Market (salvage) value Annual revenue Annual expenses $10,000 5 years $1,000 $8,000 $4,000 How much is the excess of the cash flow using the Annual Worth Method? Blank 1 Calculate the External Rate of Return. Blank 2 Compute the payback period of the investment. Blank 3 Would you recommend this investment? Explain briefly. Blank 4arrow_forwardPlease make sure to answer each step and show work. Thank you!arrow_forwardPlease make sure to answer each step and show work. Thank you!arrow_forward
 Essentials of Economics (MindTap Course List)EconomicsISBN:9781337091992Author:N. Gregory MankiwPublisher:Cengage Learning
 Principles of Economics (MindTap Course List)EconomicsISBN:9781305585126Author:N. Gregory MankiwPublisher:Cengage Learning
 Principles of Macroeconomics (MindTap Course List)EconomicsISBN:9781285165912Author:N. Gregory MankiwPublisher:Cengage Learning
 Brief Principles of Macroeconomics (MindTap Cours...EconomicsISBN:9781337091985Author:N. Gregory MankiwPublisher:Cengage Learning
 Principles of Economics, 7th Edition (MindTap Cou...EconomicsISBN:9781285165875Author:N. Gregory MankiwPublisher:Cengage Learning
 Principles of Macroeconomics (MindTap Course List)EconomicsISBN:9781305971509Author:N. Gregory MankiwPublisher:Cengage Learning