Interpretation:
The expected detection limits for given an ideal experiment has to be discussed.
Explanation of Solution
The limit for
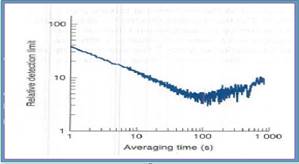
The ratio of signal to noise is increased in proportion to the square root of the number of cycles that may be averaged.
We get average of 1000 cycles is observed when the
The graph is plotted averaging time and relative detection limit.
In this graph measure the absorption of the

Figure 1
The expected detection limits for given an ideal experiment has to be discussed.
Want to see more full solutions like this?
Chapter 20 Solutions
Quantitative Chemical Analysis
- 2. Provide reagents/conditions to accomplish the following syntheses. More than one step is required in some cases. a. CH3arrow_forwardIdentify and provide an explanation that distinguishes a qualitative and quantitative chemical analysis. Provide examples.arrow_forwardIdentify and provide an explanation of the operational principles behind a Atomic Absorption Spectrometer (AAS). List the steps involved.arrow_forward
- Instructions: Complete the questions in the space provided. Show all your work 1. You are trying to determine the rate law expression for a reaction that you are completing at 25°C. You measure the initial reaction rate and the starting concentrations of the reactions for 4 trials. BrO³¯ (aq) + 5Br¯ (aq) + 6H* (aq) → 3Br₂ (l) + 3H2O (l) Initial rate Trial [BrO3] [H*] [Br] (mol/L) (mol/L) | (mol/L) (mol/L.s) 1 0.10 0.10 0.10 8.0 2 0.20 0.10 0.10 16 3 0.10 0.20 0.10 16 4 0.10 0.10 0.20 32 a. Based on the above data what is the rate law expression? b. Solve for the value of k (make sure to include proper units) 2. The proposed reaction mechanism is as follows: i. ii. BrО¸¯ (aq) + H+ (aq) → HBrO3 (aq) HBrO³ (aq) + H* (aq) → H₂BrO3* (aq) iii. H₂BrO³* (aq) + Br¯ (aq) → Br₂O₂ (aq) + H2O (l) [Fast] [Medium] [Slow] iv. Br₂O₂ (aq) + 4H*(aq) + 4Br(aq) → 3Br₂ (l) + H2O (l) [Fast] Evaluate the validity of this proposed reaction. Justify your answer.arrow_forwardе. Д CH3 D*, D20arrow_forwardC. NaOMe, Br Brarrow_forward
- Please predict the products for each of the following reactions: 1.03 2. H₂O NaNH, 1. n-BuLi 2. Mel A H₂ 10 9 0 H2SO4, H₂O HgSO4 Pd or Pt (catalyst) B 9 2 n-BuLi ♡ D2 (deuterium) Lindlar's Catalyst 1. NaNH2 2. EtBr Na, ND3 (deuterium) 2. H₂O2, NaOH 1. (Sia)2BH с Darrow_forwardin the scope of ontario SCH4U grade 12 course, please show ALL workarrow_forwardIs the chemical reaction CuCl42-(green) + 4H2O <==> Cu(H2O)42+(blue) + 4Cl- exothermic or endothermic?arrow_forward
 ChemistryChemistryISBN:9781305957404Author:Steven S. Zumdahl, Susan A. Zumdahl, Donald J. DeCostePublisher:Cengage Learning
 ChemistryChemistryISBN:9781259911156Author:Raymond Chang Dr., Jason Overby ProfessorPublisher:McGraw-Hill Education
 Principles of Instrumental AnalysisChemistryISBN:9781305577213Author:Douglas A. Skoog, F. James Holler, Stanley R. CrouchPublisher:Cengage Learning
 Organic ChemistryChemistryISBN:9780078021558Author:Janice Gorzynski Smith Dr.Publisher:McGraw-Hill Education
 Chemistry: Principles and ReactionsChemistryISBN:9781305079373Author:William L. Masterton, Cecile N. HurleyPublisher:Cengage Learning
 Elementary Principles of Chemical Processes, Bind...ChemistryISBN:9781118431221Author:Richard M. Felder, Ronald W. Rousseau, Lisa G. BullardPublisher:WILEY


