
To Analyze: The effects of currency appreciation by using an
Explanation of Solution
The relationship between supply of quantity and cost of goods or services, when represented graphically, it is called a supply curve. The point at which the supplied quantity equals the demanded quantity, then that is called an
Below shown is the diagram that represents the appreciation of currency in an economy.
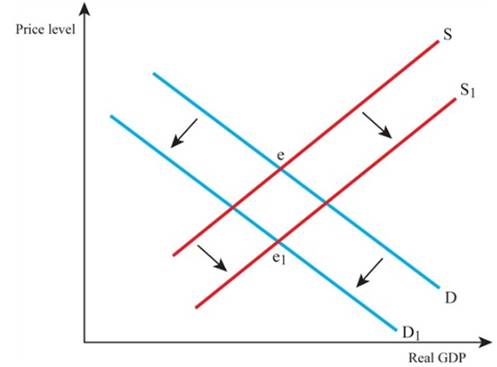
In the above mentioned graph the real
Want to see more full solutions like this?

- Supply and demand functions show different relationship between the price and quantities suppliedand demanded. Explain the reason for that relation and provide one reference with your answer.arrow_forward13:53 APP 簸洛瞭對照 Vo 56 5G 48% 48% atheva.cc/index/index/index.html The Most Trusted, Secure, Fast, Reliable Cryptocurrency Exchange Get started with the easiest and most secure platform to buy, sell, trade, and earn Cryptocurrency Balance:0.00 Recharge Withdraw Message About us BTC/USDT ETH/USDT EOS/USDT 83241.12 1841.50 83241.12 +1.00% +0.08% +1.00% Operating norms Symbol Latest price 24hFluctuation B BTC/USDT 83241.12 +1.00% ETH/USDT 1841.50 +0.08% B BTC/USD illı 83241.12 +1.00% Home Markets Trade Record Mine О <arrow_forwardThe production function of a firm is described by the following equation Q=10,000L-3L2 where Lstands for the units of labour.a) Draw a graph for this equation. Use the quantity produced in the y-axis, and the units of labour inthe x-axis. b) What is the maximum production level? c) How many units of labour are needed at that point?arrow_forward
- what is change in TC / change in Q? and what would be an example?arrow_forwardhow to solve the attachment?arrow_forwardProblem 3-ABC Challenges: Attrition, Balance and ComplianceCan television inform people about public affairs? Political scientists Bethany Albertson and Adria Lawrence (2009) conducted an experiment in which they randomly assigned people to treatment and control groups to evaluate the effect of watching TV on a person’s information level. Those assigned to the treatment group were told to watch a specific television broadcast and were later asked questions related to what they watched. Those in the controlgroup were not shown the TV broadcast but were asked questions related to the material in the TV broadcast. The dataset contains the following variables: : Dummy variable which =1 if a person reads news and 0 otherwise. : interest in political affairs (not interested=1 to very interested=4) : years of education : female dummy variable (female=1; male=0) : family income in thousands of dollars : information level (low information level=1 to high information level=4) =1 if the…arrow_forward
- Problem 2-Experiments/Randomized Control Trial Suppose you are interested in studying the effect of academic counselling on the years it takes for a student to obtain an undergraduate degree. You conduct a randomized control trial to answer the question. You randomly assign 2500 individuals in a university in New York to receive academic counselling and 2500 students to not receive any academic counselling. a. Which people are a part of the treatment group and which people are a part of thecontrol group? b. What regression will you run? Define the variables where required. c. Suppose you estimate = -0.3. Interpret it. d. You test for balance using the variables mentioned in the table below. Based on the results do you think that the treatment and control group are balanced? If your answer is “yes” then explain why. If your answer is “no”, then explain why and mention how will you address the issue of imbalance. e. Suppose that some unmotivated students in the control group decided to…arrow_forwardHow to calculate total cost?arrow_forwardProblem 1-Experiments/Randomized Control TrialSuppose you are interested in studying the effect of being a part of the labor union on anindividual’s hourly wage.You collect data on 1000 people and run the following regression. where is a dummy variable which is equal t to 1 for people who are a part of labor union and0 for others. a. Suppose you estimate . Interpret b. Do you think is biased or unbiased? Explain. Now suppose you conduct a randomized control trial to answer the same question. Yourandomly assign some individuals to be a part of the labor union and others to not be a partof the labor union. The first step you take is to ensure that the randomization was donecorrectly. Then you estimate the following equation: =1 if the student is assigned to be a part of Labor Union=0 if the student is assigned to not be a part of Labor Union c. Why is it important to ensure that the randomization is done correctly? d. Name any two variables that you can use to test if Treatment and…arrow_forward
 Managerial Economics: Applications, Strategies an...EconomicsISBN:9781305506381Author:James R. McGuigan, R. Charles Moyer, Frederick H.deB. HarrisPublisher:Cengage Learning
 Economics (MindTap Course List)EconomicsISBN:9781337617383Author:Roger A. ArnoldPublisher:Cengage Learning


 Macroeconomics: Private and Public Choice (MindTa...EconomicsISBN:9781305506756Author:James D. Gwartney, Richard L. Stroup, Russell S. Sobel, David A. MacphersonPublisher:Cengage Learning