a.
To draw: A payoff and profit diagram to depict a straddle position when the exercise price is $130.
Introduction:
Straddle Strategy: It is one of the strategies used in manipulating the call and put options. In this strategy, the investor faces a position where the call option and the put option are placed in the same position with the same strike price (X) and time (t). In other words, a straddle is supposed to be the combined value of both the call option and the put option.
a.
Answer to Problem 16PS
We can conclude that an increase in price increased profit also.
Explanation of Solution
The information given to us is as follows:
| Statement showing the prices of the options in straddles and spreads | ||||||||
| Straddles and Spreads | ||||||||
| Stock prices | ||||||||
| Market Price | 116.5 | |||||||
| Market price | 130 | X110 Straddle | X120 Straddle | |||||
| Ending Stock price | Profit | Ending Stock price | Profit | |||||
| Buying options: | -15.4 | -24 | ||||||
| Strike | Price | Payoff | Profit | Return% | 50 | 24.6 | 50 | 36 |
| 110 | 22.8 | 20 | -2.8 | -12.28% | 60 | 14.6 | 60 | 26 |
| 120 | 16.8 | 10 | -6.8 | -40.48% | 70 | 4.6 | 70 | 16 |
| 130 | 13.6 | 0 | -13.6 | -100.00% | 80 | -5.4 | 80 | 6 |
| 140 | 10.3 | 0 | -10.3 | -100.00% | 90 | -15.4 | 90 | -4 |
| 100 | -25.4 | 100 | -14 | |||||
| Strike | Price | Payoff | Profit | Return% | 110 | -35.4 | 110 | -24 |
| 110 | 12.6 | 0 | -12.6 | -100% | 120 | -25.4 | 120 | -34 |
| 120 | 17.2 | 0 | -17.2 | -100% | 130 | -15.4 | 130 | -24 |
| 130 | 23.6 | 0 | -23.6 | -100% | 140 | -5.4 | 140 | -14 |
| 140 | 30.5 | 10 | -20.5 | -67.21% | 150 | 4.6 | 150 | -4 |
| 160 | 14.6 | 160 | 6 | |||||
| Straddle | Price | Payoff | Profit | Return% | 170 | 24.6 | 170 | 16 |
| 110 | 35.4 | 20 | -15.4 | -43.50% | 180 | 34.6 | 180 | 26 |
| 120 | 34 | 10 | -24 | -70.59% | 190 | 44.6 | 190 | 36 |
| 130 | 37.2 | 0 | -37.2 | -100% | 200 | 54.6 | 200 | 46 |
| 140 | 40.8 | 10 | -30.8 | -75.49% | 210 | 64.6 | 210 | 56 |
| Selling options: | ||||||||
| Call options | Price | Payoff | Profit | Return% | Ending | Bullish Spread | ||
| Stock price | 7.5 | |||||||
| 110 | 22.8 | -20 | 2.8 | 12.28% | 50 | -12.5 | ||
| 120 | 16.8 | -10 | 6.8 | 40.48% | 60 | -12.5 | ||
| 130 | 13.6 | 0 | 13.6 | 100.00% | 70 | -12.5 | ||
| 140 | 10.3 | 0 | 10.3 | 100.00% | 80 | -12.5 | ||
| 90 | -12.5 | |||||||
| Put options | Price | Payoff | Profit | Return% | 100 | -12.5 | ||
| 110 | 16.6 | 0 | 12.6 | 100.00% | 110 | -12.5 | ||
| 120 | 17.2 | 0 | 17.2 | 100.00% | 120 | -2.5 | ||
| 130 | 23.6 | 0 | 23.6 | 100.00% | 130 | 7.5 | ||
| 140 | 30.5 | 10 | 40.5 | 132.79% | 140 | 17.5 | ||
| 150 | 17.5 | |||||||
| Money spread | Price | Payoff | Profit | 160 | 17.5 | |||
| Bullish spread | 170 | 17.5 | ||||||
| Purchase of Call option at 110 | 22.8 | 20 | -2.8 | 180 | 17.5 | |||
| Selling of Call option at 140 | 10.3 | 0 | 10.3 | 190 | 17.5 | |||
| Combined profit | 20 | 7.5 | 200 | 17.5 | ||||
| 210 | 17.5 | |||||||
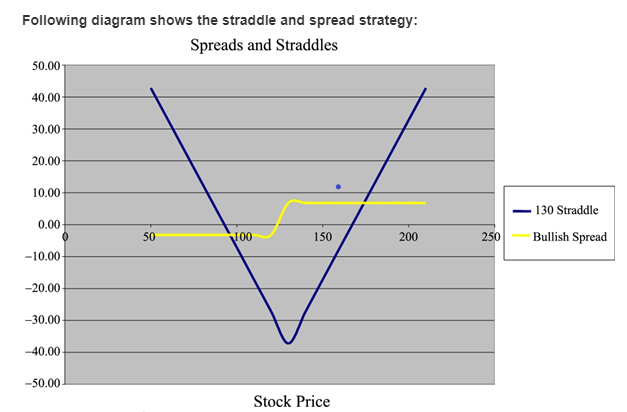
Let us use the same diagram for both the answers. Let us now understand the depiction of payoff and profit using a straddle strategy.
Like said before, in straddle strategy, both the call position and put position will be placed at the same place with the same strike price and expiration time. Let us observe the diagram. The blue shows the payoff and profit using a straddle strategy.
This diagram clears shows that when the price option of $110, the payoff is $20 and the net profit earned is $34.60. In a case where the price is $120, the profit earned is $44.60 and when the price rises to $130 the profit earned also rises to $54.60. Therefore, it means an increase in price increased profit also.
b.
To draw: A payoff and profit diagram to depict a bullish spread position when the exercise price is $120 and $130 assuming the excel position.
Introduction:
Bullish spread position: It is supposed to be a very optimistic option strategy. It is designed in such a way that profit can be earned even if there is a moderate increase in the price of the underlying asset.
b.
Answer to Problem 16PS
We can conclude that irrespective of a decline in market conditions, a net profit of $7.50 is earned.
Explanation of Solution
The information given to us is as follows:
| Statement showing the prices of the options in straddles and spreads | ||||||||
| Straddles and Spreads | ||||||||
| Stock prices | ||||||||
| Market Price | 116.5 | |||||||
| Market price | 130 | X110 Straddle | X120 Straddle | |||||
| Ending Stock price | Profit | Ending Stock price | Profit | |||||
| Buying options: | -15.4 | -24 | ||||||
| Strike | Price | Payoff | Profit | Return% | 50 | 24.6 | 50 | 36 |
| 110 | 22.8 | 20 | -2.8 | -12.28% | 60 | 14.6 | 60 | 26 |
| 120 | 16.8 | 10 | -6.8 | -40.48% | 70 | 4.6 | 70 | 16 |
| 130 | 13.6 | 0 | -13.6 | -100.00% | 80 | -5.4 | 80 | 6 |
| 140 | 10.3 | 0 | -10.3 | -100.00% | 90 | -15.4 | 90 | -4 |
| 100 | -25.4 | 100 | -14 | |||||
| Strike | Price | Payoff | Profit | Return% | 110 | -35.4 | 110 | -24 |
| 110 | 12.6 | 0 | -12.6 | -100% | 120 | -25.4 | 120 | -34 |
| 120 | 17.2 | 0 | -17.2 | -100% | 130 | -15.4 | 130 | -24 |
| 130 | 23.6 | 0 | -23.6 | -100% | 140 | -5.4 | 140 | -14 |
| 140 | 30.5 | 10 | -20.5 | -67.21% | 150 | 4.6 | 150 | -4 |
| 160 | 14.6 | 160 | 6 | |||||
| Straddle | Price | Payoff | Profit | Return% | 170 | 24.6 | 170 | 16 |
| 110 | 35.4 | 20 | -15.4 | -43.50% | 180 | 34.6 | 180 | 26 |
| 120 | 34 | 10 | -24 | -70.59% | 190 | 44.6 | 190 | 36 |
| 130 | 37.2 | 0 | -37.2 | -100% | 200 | 54.6 | 200 | 46 |
| 140 | 40.8 | 10 | -30.8 | -75.49% | 210 | 64.6 | 210 | 56 |
| Selling options: | ||||||||
| Call options | Price | Payoff | Profit | Return% | Ending | Bullish Spread | ||
| Stock price | 7.5 | |||||||
| 110 | 22.8 | -20 | 2.8 | 12.28% | 50 | -12.5 | ||
| 120 | 16.8 | -10 | 6.8 | 40.48% | 60 | -12.5 | ||
| 130 | 13.6 | 0 | 13.6 | 100.00% | 70 | -12.5 | ||
| 140 | 10.3 | 0 | 10.3 | 100.00% | 80 | -12.5 | ||
| 90 | -12.5 | |||||||
| Put options | Price | Payoff | Profit | Return% | 100 | -12.5 | ||
| 110 | 16.6 | 0 | 12.6 | 100.00% | 110 | -12.5 | ||
| 120 | 17.2 | 0 | 17.2 | 100.00% | 120 | -2.5 | ||
| 130 | 23.6 | 0 | 23.6 | 100.00% | 130 | 7.5 | ||
| 140 | 30.5 | 10 | 40.5 | 132.79% | 140 | 17.5 | ||
| 150 | 17.5 | |||||||
| Money spread | Price | Payoff | Profit | 160 | 17.5 | |||
| Bullish spread | 170 | 17.5 | ||||||
| Purchase of Call option at 110 | 22.8 | 20 | -2.8 | 180 | 17.5 | |||
| Selling of Call option at 140 | 10.3 | 0 | 10.3 | 190 | 17.5 | |||
| Combined profit | 20 | 7.5 | 200 | 17.5 | ||||
| 210 | 17.5 | |||||||

Let us use the same diagram for here also. Let us now understand the depiction of payoff and profit using a bullish spread strategy. The yellow line shown in the diagram depicts payoff and profit using a bullish spread strategy. When the diagram is observed, we find that when a call option is purchased at $110, the market is decreasing. When a call option is sold at $140, the net profit earned is $7.50. So, irrespective of a decline in market conditions, a net profit of $7.50 is earned.
Want to see more full solutions like this?
Chapter 20 Solutions
Investments

- Which of the following is a money market instrument?A) Treasury bondsB) Corporate bondsC) Commercial paperD) Common stock need help!!arrow_forwardFinance Subject.Which of the following is a money market instrument?A) Treasury bondsB) Corporate bondsC) Commercial paperD) Common stockarrow_forwardHelp please without use of AI. no What is the main purpose of financial ratios?A) To guarantee a company's profitabilityB) To evaluate a company's financial performance and healthC) To increase a company's stock priceD) To ensure a company's debts are eliminatedarrow_forward
- Please don't use ai tool If a stock’s beta is 1.5, what does this indicate?A) The stock is less volatile than the marketB) The stock is more volatile than the marketC) The stock is not correlated with the market D) The stock is risk-freearrow_forwardNo ai What is the primary function of a financial market?A) To set interest ratesB) To facilitate the transfer of funds between savers and borrowersC) To regulate the banking industryD) To manage the government’s budgetarrow_forwardno What is the main purpose of financial ratios?A) To guarantee a company's profitabilityB) To evaluate a company's financial performance and healthC) To increase a company's stock priceD) To ensure a company's debts are eliminatedarrow_forward
- please don't use chatgpt What happens to the value of money when inflation increases?A) The value of money increasesB) The value of money decreasesC) The value of money remains unchangedD) The value of money fluctuates randomly helparrow_forwardDo not use Ai tool What happens to the value of money when inflation increases?A) The value of money increasesB) The value of money decreasesC) The value of money remains unchangedD) The value of money fluctuates randomlyarrow_forwardNo AI tool. Which of the following best defines a bond's coupon rate?A) The market rate of interest on the bondB) The annual interest payment as a percentage of the bond's face valueC) The difference between the bond's face value and its market priceD) The total return from holding the bond to maturityarrow_forward
- No ai!! answer it A portfolio's risk can be reduced by: A) Investing in a single stock B) Diversifying investments across different asset classes C) Borrowing money to invest more D) Only investing in high-risk assets need help.arrow_forwardNo chatgpt! A portfolio's risk can be reduced by: A) Investing in a single stock B) Diversifying investments across different asset classes C) Borrowing money to invest more D) Only investing in high-risk assets need help!arrow_forwardNo chatgpt!! A portfolio's risk can be reduced by:A) Investing in a single stockB) Diversifying investments across different asset classesC) Borrowing money to invest moreD) Only investing in high-risk assetsarrow_forward
 Essentials Of Business AnalyticsStatisticsISBN:9781285187273Author:Camm, Jeff.Publisher:Cengage Learning,
 Principles of Cost AccountingAccountingISBN:9781305087408Author:Edward J. Vanderbeck, Maria R. MitchellPublisher:Cengage Learning
 Essentials of Business Analytics (MindTap Course ...StatisticsISBN:9781305627734Author:Jeffrey D. Camm, James J. Cochran, Michael J. Fry, Jeffrey W. Ohlmann, David R. AndersonPublisher:Cengage Learning
 Excel Applications for Accounting PrinciplesAccountingISBN:9781111581565Author:Gaylord N. SmithPublisher:Cengage Learning
 Financial Reporting, Financial Statement Analysis...FinanceISBN:9781285190907Author:James M. Wahlen, Stephen P. Baginski, Mark BradshawPublisher:Cengage Learning