Concept explainers
Figure 20.2 shows a reddish glow around the star Antares, and yet the caption says that is a dust cloud. What observations would you make to determine whether the red glow is actually produced by dust or whether it is produced by an H II region?
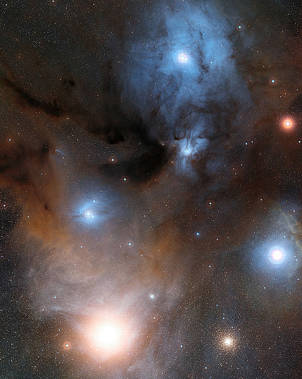
Figure 20.2 Various Types of Interstellar Matter. The reddish nebulae in this spectacular photograph glow with light emitted by hydrogen atoms. The darkest areas are clouds of dust that block the light from stars behind them. The upper part of the picture is filled with the bluish glow of light reflected from hot stars embedded in the outskirts of a huge, cool cloud of dust and gas. The cool supergiant star Antares can be seen as a big, reddish patch in the lower-left part of the picture. The star is shedding some of its outer atmosphere and is surrounded by a cloud of its own making that reflects the red light of the star. The red nebula in the middle right partially surrounds the star Sigma Scorpii. (To the right of Antares, you can see M4, a much more distant cluster of extremely old stars.) (credit: modification of work by ESO/Digitized Sky Survey 2)
Want to see the full answer?
Check out a sample textbook solution
Chapter 20 Solutions
Astronomy
Additional Science Textbook Solutions
Campbell Biology (11th Edition)
Campbell Biology: Concepts & Connections (9th Edition)
Physics for Scientists and Engineers: A Strategic Approach, Vol. 1 (Chs 1-21) (4th Edition)
Human Biology: Concepts and Current Issues (8th Edition)
Applications and Investigations in Earth Science (9th Edition)
Anatomy & Physiology (6th Edition)


- You want to fabricate a soft microfluidic chip like the one below. How would you go about fabricating this chip knowing that you are targeting a channel with a square cross-sectional profile of 200 μm by 200 μm. What materials and steps would you use and why? Disregard the process to form the inlet and outlet. Square Cross Sectionarrow_forward1. What are the key steps involved in the fabrication of a semiconductor device. 2. You are hired by a chip manufacturing company, and you are asked to prepare a silicon wafer with the pattern below. Describe the process you would use. High Aspect Ratio Trenches Undoped Si Wafer P-doped Si 3. You would like to deposit material within a high aspect ratio trench. What approach would you use and why? 4. A person is setting up a small clean room space to carry out an outreach activity to educate high school students about patterning using photolithography. They obtained a positive photoresist, a used spin coater, a high energy light lamp for exposure and ordered a plastic transparency mask with a pattern on it to reduce cost. Upon trying this set up multiple times they find that the full resist gets developed, and they are unable to transfer the pattern onto the resist. Help them troubleshoot and find out why pattern of transfer has not been successful. 5. You are given a composite…arrow_forwardTwo complex values are z1=8 + 8i, z2=15 + 7 i. z1∗ and z2∗ are the complex conjugate values. Any complex value can be expessed in the form of a+bi=reiθ. Find r and θ for (z1-z∗2)/z1+z2∗. Find r and θ for (z1−z2∗)z1z2∗ Please show all stepsarrow_forward
- An electromagnetic wave is traveling through vacuum in the positive x direction. Its electric field vector is given by E=E0sin(kx−ωt)j^,where j^ is the unit vector in the y direction. If B0 is the amplitude of the magnetic field vector, find the complete expression for the magnetic field vector B→ of the wave. What is the Poynting vector S(x,t), that is, the power per unit area associated with the electromagnetic wave described in the problem introduction? Give your answer in terms of some or all of the variables E0, B0, k, x, ω, t, and μ0. Specify the direction of the Poynting vector using the unit vectors i^, j^, and k^ as appropriate. Please explain all stepsarrow_forwardAnother worker is performing a task with an RWL of only 9 kg and is lifting 18 kg, giving him an LI of 2.0 (high risk). Questions:What is the primary issue according to NIOSH?Name two factors of the RWL that could be improved to reduce risk.If the horizontal distance is reduced from 50 cm to 30 cm, how does the HM change and what effect would it have?arrow_forwardTwo complex values are z1=8 + 8i, z2=15 + 7 i. z1∗ and z2∗ are the complex conjugate values. Any complex value can be expessed in the form of a+bi=reiθ. Find r and θ for z1z2∗. Find r and θ for z1/z2∗? Find r and θ for (z1−z2)∗/z1+z2∗. Find r and θ for (z1−z2)∗/z1z2∗ Please explain all steps, Thank youarrow_forward
- An ac series circuit consists of a voltage source of frequency 60 Hz and voltage amplitude V, a 505-Ω resistor, and a capacitor of capacitance 7.2 μF. What must be the source voltage amplitude V for the average electrical power consumed in the resistor to be 236 W? There is no inductance in the circuit.arrow_forwardAn L−R−C series circuit has R= 280 Ω . At the frequency of the source, the inductor has reactance XLL= 905 Ω and the capacitor has reactance XC= 485 Ω . The amplitude of the voltage across the inductor is 445 V . What is the amplitude of the voltage across the resistor and the capacitor? What is the voltage amplitude of the source? What is the rate at which the source is delivering electrical energy to the circuit?arrow_forwardA 0.185 H inductor is connected in series with a 98.5 Ω resistor and an ac source. The voltage across the inductor is vL=−(12.5V)sin[(476rad/s)t]vL. Derive an expression for the voltage vR across the resistor. Express your answer in terms of the variables L, R, VL (amplitude of the voltage across the inductor), ω, and t. What is vR at 2.13 ms ? Please explain all stepsarrow_forward
- A worker lifts a box under the following conditions:Horizontal distance (H): 30 cmInitial height (V): 60 cmVertical travel (D): 50 cmTorso rotation (A): 30°Frequency: 3 times/minute for 1 hourGrip: Good Question:What is the RWL for this task?What does this value mean in terms of occupational safety?arrow_forwardCan someone helparrow_forwardCan someone help mearrow_forward
 Foundations of Astronomy (MindTap Course List)PhysicsISBN:9781337399920Author:Michael A. Seeds, Dana BackmanPublisher:Cengage Learning
 Stars and Galaxies (MindTap Course List)PhysicsISBN:9781337399944Author:Michael A. SeedsPublisher:Cengage Learning
 AstronomyPhysicsISBN:9781938168284Author:Andrew Fraknoi; David Morrison; Sidney C. WolffPublisher:OpenStax
 Horizons: Exploring the Universe (MindTap Course ...PhysicsISBN:9781305960961Author:Michael A. Seeds, Dana BackmanPublisher:Cengage Learning
 Stars and GalaxiesPhysicsISBN:9781305120785Author:Michael A. Seeds, Dana BackmanPublisher:Cengage Learning