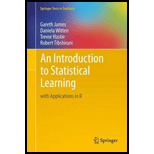
An Introduction to Statistical Learning: with Applications in R (Springer Texts in Statistics)
13th Edition
ISBN: 9781461471370
Author: Gareth James
Publisher: SPRINGER NATURE CUSTOMER SERVICE
expand_more
expand_more
format_list_bulleted
Expert Solution & Answer
Chapter 2, Problem 9E
a.
Explanation of Solution
Predictors
- Name is qualitative, the rest are quantitative.
- However, looking at summary(), it is notic...
b.
Explanation of Solution
Range of predictor
- The range of each quantitative pred...
c.
Explanation of Solution
Mean and standard deviation of predictor
- Using signif() function, it can be round to two significant digits...
d.
Explanation of Solution
Range,median and standard deviation of predictor
- Using round() function, it rounds to two decimal places rather than two significant digits...
e.
Explanation of Solution
Simple linear regression
- It is easy to see that if xi is replac...
f.
Explanation of Solution
Predictors
- After plotting predictors graphically, it will be
library(pheatmap)
pheatmap(t(scale(as...
Expert Solution & Answer
Trending nowThis is a popular solution!
Students have asked these similar questions
We created some models for a dataset and, for each model we computed its R2
score. The results are presented in the table below:
Model
m1
m2
m3
m4
m5
R2
0.85
0.76
0.87
0.68
0.79
What model should we use from the ones presented in the table? Justify your
answer.
Answer:
Draw a QQ (quantile-quantile) plot for the built-in data set, islands, to assess the normality of the observations. Is the data set well-modeled by a normal distribution?
If we add more independent variables into the model:
A.
The adjusted R2 value will increase.
B.
The R2 value will increase.
C.
The R2 value will decrease if the variables we are adding into the model should not be there.
D.
The R2 will be biased.
Chapter 2 Solutions
An Introduction to Statistical Learning: with Applications in R (Springer Texts in Statistics)
Knowledge Booster
Similar questions
- Explain what autocorrelation indicates . What are the main problems that autocorrelation creates for OLS estimation results ? Give two ways to detect autocorrelation problem and the hypothesis that are tested ?arrow_forwardIn python, for a sample data with 4 columns and 60 rows how do you find the parameters for the regression with the feature map (see attached) where we consider the loss function to be the square of residuals. Once this is done, how do you compute the empirical risk? I've attached some of the data below, it would be sufficient to see how you get results for the question using the above dataset. 1 14 25 620 -1 69 29 625 0 83 27 850 0 28 25 1315 1 41 25 2120 -1 153 31 1315 0 55 25 2600 0 55 31 490 1 69 25 3110 1 83 25 3535arrow_forwardUsing Matlab, please provide the script code necessary to find the result: By simulation, generate 10000 Random Samples (size n = 1) from an Exponential Distribution with µ = 10. Generate a histogram of the data and label it “n = 1”. Observe the shape of the histogram, which will be skewed right. Include the histogram in your report along with the mean and standard deviation of this sample of 10000 data points.arrow_forward
- 1. Suppose that a set of samples x1, x2, ..., xn, all real numbers, are drawn i.i.d. from the same distribution. Also assume that this distribution is a Gaussian distribution, which can be represented as N(u, o²). Write a function that accepts a set of samples and returns the MLE estimator for u. NOTE: The code below will be evaluated by a Python 2.7 interpreter. def mle(samples): pass Run Reset Once your function is correct, your will receive a submission code that you should input into the answer field. Enter answer here 2. In the previous question, you were asked to write a function for an estimator of a parameter of a distribution. Is the result of this function, an estimator, a random variable? Yes Noarrow_forwardThis is a coding question. Now that you have worked out the gradient descent and the update rules. "Try to progrum a Ridge regression. Please complete the coding. Note that here the data set we use has just one explanatory variable and the Ridge regression we try to create here has just one variable (or feature). Now that you have finished the program. What are the observations and the corresponding predictions using Ridge? Now, make a plot to showease how well your model predicts against the observations. Use spatter plot for observations, line plot for your model predictions. Observations are in color red. and predictions are in color green. Add appropriate labels to the x axis and y axis and a title to the plot You may also nood to fine tune hyperparameters such as leurning rate and the number of'aterations.arrow_forwardName the concept: The variance of e i is the same for every observation. A. Heteroscedasticity B. Bias C. Homoscedasticity D. Consistencyarrow_forward
- Two engineers were independently testing a cubic polynomial regression model on the same dataset. The first engineer used the validation set approach, while the second one used 10-fold cross-validation to estimate test MSE. Both of them repeated the test 20 times, each time with a different set.seed() number. Then, each engineer calculated the mean and the standard deviation of his 20 estimated test MSE. Which of the following statement is most likely true? • The standard deviation of MSE from the first engineer will be greater than the standard deviation of MSE from the second engineer. • The mean MSE from the first engineer will be less than the mean MSE from the second engineer. • The mean MSE from the first engineer will be greater than the mean MSE from the second engineer. • The standard deviation of MSE from the first engineer will be less than the standard deviation of MSE from the second engineer.arrow_forwardThis is a coding question. Now that you have worked out the gradient descent and the update rules. Try to progrum a Ridge regression. Please complete the coding. Note that here the data sct we use has just one explanatory variable and the Ridge regression we try to create here has just one variable (or feature). Now that you have finished the program. What are the observations and the corresponding predictions using Ridge? Now, make a plot to showoase how well your model predicts against the observations. Use scatter plot for observations, line plot for your model predictions. Observations are in color red. and prodictions are in color green. Add appropriate labeis to the x axis and y axis and a title to the plot You may also need to fine tune hyperparameters such as Icurning rate and the number ofliterations.arrow_forwardCompute the area under the curve (AUC) for this classifier and write it as a decimal number on [0,1]arrow_forward
- What Is The sample linear correlation?arrow_forward1. What do the measures of central tendency tell us about? Which statistics measure central tendency? 2. What do the measures of spread tell us about? Which statistics measure the spread of data? 3. There are specific “pairs” of central tendency and spread. What are these? (Which measures can only be used with each other?)arrow_forwardThe data mining technique involved in predicting a categorical response is called as. A. Regression B. Classification C. Clustering D. Summarizationarrow_forward
arrow_back_ios
SEE MORE QUESTIONS
arrow_forward_ios
Recommended textbooks for you
- Database System ConceptsComputer ScienceISBN:9780078022159Author:Abraham Silberschatz Professor, Henry F. Korth, S. SudarshanPublisher:McGraw-Hill EducationStarting Out with Python (4th Edition)Computer ScienceISBN:9780134444321Author:Tony GaddisPublisher:PEARSONDigital Fundamentals (11th Edition)Computer ScienceISBN:9780132737968Author:Thomas L. FloydPublisher:PEARSON
- C How to Program (8th Edition)Computer ScienceISBN:9780133976892Author:Paul J. Deitel, Harvey DeitelPublisher:PEARSONDatabase Systems: Design, Implementation, & Manag...Computer ScienceISBN:9781337627900Author:Carlos Coronel, Steven MorrisPublisher:Cengage LearningProgrammable Logic ControllersComputer ScienceISBN:9780073373843Author:Frank D. PetruzellaPublisher:McGraw-Hill Education
Database System Concepts
Computer Science
ISBN:9780078022159
Author:Abraham Silberschatz Professor, Henry F. Korth, S. Sudarshan
Publisher:McGraw-Hill Education
Starting Out with Python (4th Edition)
Computer Science
ISBN:9780134444321
Author:Tony Gaddis
Publisher:PEARSON
Digital Fundamentals (11th Edition)
Computer Science
ISBN:9780132737968
Author:Thomas L. Floyd
Publisher:PEARSON
C How to Program (8th Edition)
Computer Science
ISBN:9780133976892
Author:Paul J. Deitel, Harvey Deitel
Publisher:PEARSON
Database Systems: Design, Implementation, & Manag...
Computer Science
ISBN:9781337627900
Author:Carlos Coronel, Steven Morris
Publisher:Cengage Learning
Programmable Logic Controllers
Computer Science
ISBN:9780073373843
Author:Frank D. Petruzella
Publisher:McGraw-Hill Education