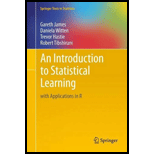
An Introduction to Statistical Learning: with Applications in R (Springer Texts in Statistics)
13th Edition
ISBN: 9781461471370
Author: Gareth James
Publisher: SPRINGER NATURE CUSTOMER SERVICE
expand_more
expand_more
format_list_bulleted
Concept explainers
Expert Solution & Answer
Chapter 2, Problem 7E
a.
Explanation of Solution
Euclidean distance
| X1 | X2 | X3 | Y | Distance from origin |
| 0 | 3 | 0 | Red | 3 |
| 2 | ... |
b.
Explanation of Solution
Prediction of value k
- Prediction with K=1 is Green...
c.
Explanation of Solution
Prediction of value k
- Prediction with K=1 is Green.
- This is because t...
d.
Explanation of Solution
Bayes decision boundary
- When K becomes larger, we get a smoother boundary...
Expert Solution & Answer
Want to see the full answer?
Check out a sample textbook solution
Students have asked these similar questions
Information Security Risk and Vulnerability Assessment
1- Which TCP/IP protocol is used to convert the IP address to the Mac address? Explain 2-What popular switch feature allows you to create communication boundaries between systems connected to the switch3- what types of vulnerability directly related to the programmer of the software?4- Who ensures the entity implements appropriate security controls to protect an asset?
Please do not use AI and add refrence
Find the voltage V0 across the 4K resistor using the mesh method or nodal analysis. Note: I have already simulated it and the value it should give is -1.714V
Resolver por superposicion
Chapter 2 Solutions
An Introduction to Statistical Learning: with Applications in R (Springer Texts in Statistics)
Knowledge Booster
Learn more about
Need a deep-dive on the concept behind this application? Look no further. Learn more about this topic, computer-science and related others by exploring similar questions and additional content below.Similar questions
- Describe three (3) Multiplexing techniques common for fiber optic linksarrow_forwardCould you help me to know features of the following concepts: - commercial CA - memory integrity - WMI filterarrow_forwardBriefly describe the issues involved in using ATM technology in Local Area Networksarrow_forward
- For this question you will perform two levels of quicksort on an array containing these numbers: 59 41 61 73 43 57 50 13 96 88 42 77 27 95 32 89 In the first blank, enter the array contents after the top level partition. In the second blank, enter the array contents after one more partition of the left-hand subarray resulting from the first partition. In the third blank, enter the array contents after one more partition of the right-hand subarray resulting from the first partition. Print the numbers with a single space between them. Use the algorithm we covered in class, in which the first element of the subarray is the partition value. Question 1 options: Blank # 1 Blank # 2 Blank # 3arrow_forward1. Transform the E-R diagram into a set of relations. Country_of Agent ID Agent H Holds Is_Reponsible_for Consignment Number $ Value May Contain Consignment Transports Container Destination Ф R Goes Off Container Number Size Vessel Voyage Registry Vessel ID Voyage_ID Tonnagearrow_forwardI want to solve 13.2 using matlab please helparrow_forward
- a) Show a possible trace of the OSPF algorithm for computing the routing table in Router 2 forthis network.b) Show the messages used by RIP to compute routing tables.arrow_forwardusing r language to answer question 4 Question 4: Obtain a 95% standard normal bootstrap confidence interval, a 95% basic bootstrap confidence interval, and a percentile confidence interval for the ρb12 in Question 3.arrow_forwardusing r language to answer question 4. Question 4: Obtain a 95% standard normal bootstrap confidence interval, a 95% basic bootstrap confidence interval, and a percentile confidence interval for the ρb12 in Question 3.arrow_forward
arrow_back_ios
SEE MORE QUESTIONS
arrow_forward_ios
Recommended textbooks for you
 Operations Research : Applications and AlgorithmsComputer ScienceISBN:9780534380588Author:Wayne L. WinstonPublisher:Brooks ColeNp Ms Office 365/Excel 2016 I NtermedComputer ScienceISBN:9781337508841Author:CareyPublisher:Cengage
 C++ for Engineers and ScientistsComputer ScienceISBN:9781133187844Author:Bronson, Gary J.Publisher:Course Technology Ptr
 Information Technology Project ManagementComputer ScienceISBN:9781337101356Author:Kathy SchwalbePublisher:Cengage Learning
 Principles of Information Systems (MindTap Course...Computer ScienceISBN:9781305971776Author:Ralph Stair, George ReynoldsPublisher:Cengage LearningCOMPREHENSIVE MICROSOFT OFFICE 365 EXCEComputer ScienceISBN:9780357392676Author:FREUND, StevenPublisher:CENGAGE L

Operations Research : Applications and Algorithms
Computer Science
ISBN:9780534380588
Author:Wayne L. Winston
Publisher:Brooks Cole

Np Ms Office 365/Excel 2016 I Ntermed
Computer Science
ISBN:9781337508841
Author:Carey
Publisher:Cengage

C++ for Engineers and Scientists
Computer Science
ISBN:9781133187844
Author:Bronson, Gary J.
Publisher:Course Technology Ptr

Information Technology Project Management
Computer Science
ISBN:9781337101356
Author:Kathy Schwalbe
Publisher:Cengage Learning

Principles of Information Systems (MindTap Course...
Computer Science
ISBN:9781305971776
Author:Ralph Stair, George Reynolds
Publisher:Cengage Learning

COMPREHENSIVE MICROSOFT OFFICE 365 EXCE
Computer Science
ISBN:9780357392676
Author:FREUND, Steven
Publisher:CENGAGE L