
(a)
To find:
The shortage and full economic
Answer to Problem 8CACQ
There is shortage of three units and thefull economic price is $12.
Explanation of Solution
The diagram given below shows the effect of
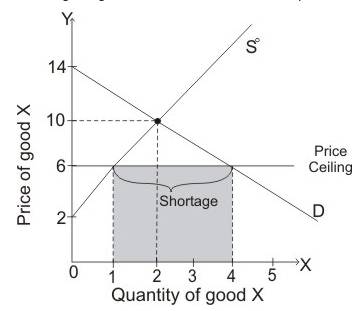
When demand curve is D and Supply curve is S0, then equilibrium is attained when price of commodity is $10 and the quantity demanded is 2 units. When government imposed the price ceiling of $6 then quantity demanded is 2 units. When government imposed the price ceiling of $6 then quantity demanded is greater than the quantity supplied so there is shortage of goods in an economy. Thus, there is shortage of 3 units.The shaded area in the diagram shows the shortage of goods in an economy.
Full economic price is the total amount paid by the consumer in getting the product.
Price ceiling:
Price ceiling is the minimum price imposed by a government below which goods are supplied.
Full economic price:
Full economic price is the total amount paid by the consumer in getting the product below the imposed price ceiling.
(b)
To find:
The surplus as a result of imposition of $12 as price support and costs to the government in purchasing the units and all unsold units.
Answer to Problem 8CACQ
The costs to the government in purchasing units is $12.
Explanation of Solution
The diagram given below shows the effect of
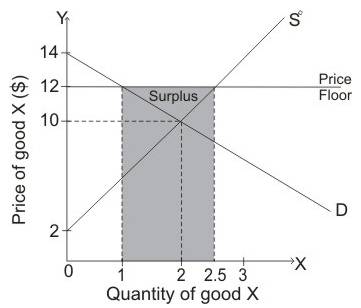
When demand curve is D and Supply curve is S0then equilibrium is attained when price of commodity is $10 and quantity demanded is 2 units. When government imposed the price floor of $12, then quantity supplied is greater than the quantity demanded so there is surplus of goods in an economy. Thus, there is surplus of 1.5units.
The shaded area in the diagram shows the surplus of good in an economy.
When price of commodity is more than the
Price floor:
Price floor is the maximum price which government has imposed above which goods are sold in the market.
(c)
To find:
The equilibrium price after excise tax of $6 is imposed, the price received by producers and the number of units that are sold.
Answer to Problem 8CACQ
The price paid by consumer is $12 per unit while the price received by the producer is $6 per unit. The number of units sold is 1 unit.
Explanation of Solution
When equilibrium price is $10 and government imposes excise tax of $6, then supply curve will shift leftwards from S0 to S1,which leads to rise in equilibrium price from $10 to $12. At equilibrium price of $12, quantity demanded is 1 unit.
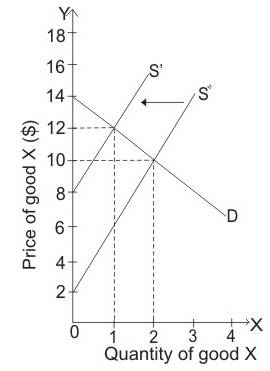
The price paid by consumer is $12 per unit while the price received by the producer is $6 per unit. The number of units sold is 1 unit.
Excise tax:
An excise tax is a tax imposed on manufacturers for producing goods.
(d)
To explain:
The level of
Answer to Problem 8CACQ
The value of
Explanation of Solution
When demand curve D and supply curve S0 intersects then equilibrium is attained at price of $10 while equilibrium quantity is attained at 2 units.
Consumer surplus is the below demand curve and above the price level $10. So, consumer’s surplus is equal to:
Thus, the value of consumer surplus is $4.
Producer surplus is the area above curve and below the price level $10. So, producer’s surplus is equal to:
Thus, the value of producer surplus is $4.
Consumer surplus:
Consumer surplus is the variance in the amount that consumers are ready to pay and the price which is actually paid by them. The area of consumer surplus is below the demand curve and above the price.
Consumer surplus:
Producer surplus is the variance in the amount at which producers accept the quantity and the amount at which they sell. Producer surplus is the area above curve and below the price level.
(e)
To explain:
Whether the price can be benefitted with the price ceiling of $2.
Explanation of Solution
When price ceiling is $2 then producers do not want to produce any commodity while consumers want to consume any commodity which is produced.
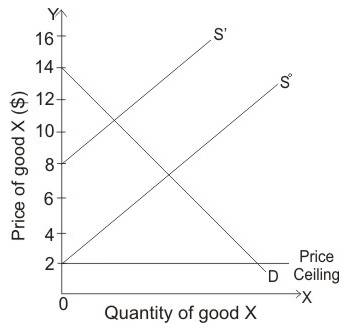
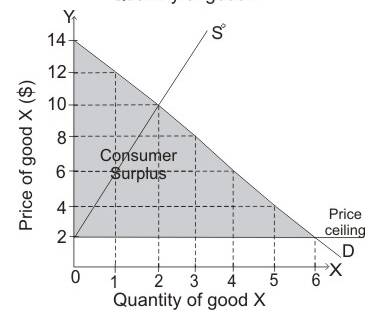
At price of $2, all consumers will benefit if producers supply commodity but at this low-price firms are not interested to produce any commodity.
Price ceiling:
Price ceiling is the maximum price imposed by a government below which goods are supplied.
Want to see more full solutions like this?
Chapter 2 Solutions
Connect Access Card for Managerial Econnomics
- Andrew’s utility depends on consuming L, hours of leisure and Y a composite good. Andrew can work as many hours as he wants to at the wage rate of w, and the price of Y is $1. Andrew’s indifference curves exhibit diminishing MRS. When Andrew’s wage rate decreases, he spends less time working. Answer the following questions using a indifference curve-budget line diagram. Explain your answers carefully. a. Does the substitution effect cause him to work less hours? (If the direction of the effect is ambiguous, say so, and show why on your diagram) b. Does the income effect cause him to work less hours? (If the direction of the effect is ambiguous, say so, and show why on your diagram)arrow_forwardNot use ai pleasearrow_forwardNot use ai pleasearrow_forward
- epidemology/economicsarrow_forwardDon't use ai to answer I will report you answerarrow_forwardWhich of the following is true about the concept of concentration? Group of answer choices The lower the degree of rivalry amongst the firms, the higher the concentration. The lower the number of firms in a market, the lower the concentration. All of the answers are correct. The higher the degree of rivalry amongst the firms, the lower the concentrationarrow_forward
- ↑ Quiz x Chat × | Use ☑ Micr ☑ Price × b Ans × b Suco × b Anst ✓ Pow × 1.6: ✓ ECO ☑ #26 ☑ #27 ✓ #28 ✓ -0 -0 setonhall.instructure.com/courses/30968/quizzes/52774/take/questions/1035198 Question 15 2 pts Use the information contained in the graph below describing a firm operating in a competitive environment to answer the following question. If the graph described a firm that decides to produce, what would be the value of its profit, its deficit, or would it break even? $7 385 $8 $4 4 120 150 30 50 50 None of the answers are correct. #29 × N. price × | + ☆ ☑ B Relaunch to update :arrow_forward↑ Quiz: F X . ChatG × G Use th × b Answe × b Answe ☑ Micros ☑ Power × 1.6: A ☑ ECON ✓ #26 - X #27 - X #28 - X #29 - × G is mr c ×+ -o -0 setonhall.instructure.com/courses/30968/quizzes/52774/take/questions/1035213 Q ☆ B Relaunch to update : Question 9 2 pts Use the information contained in the three graphs below to answer the following question. Which of the three curves represent the MR? (A) (B) $800 $800 $800 $700 $700 $700 $600 $600 $600 $500 $500 $500 67 S S $400 $400 $400 $300 $300 $300 $200 $200 $200 $100 $100 $100 50 50 30 01 01 2 34 01 A None of the curves could be the answer. C B (C)arrow_forwardProfits will be_________? Group of answer choices High, regardless of the degree of rivalry between competitors. Low, when the degree of rivalry between competitors is low. High, when the degree of rivalry between competitors is high. Low, when the degree of rivalry between competitors is high.arrow_forward

 Principles of Economics (12th Edition)EconomicsISBN:9780134078779Author:Karl E. Case, Ray C. Fair, Sharon E. OsterPublisher:PEARSON
 Engineering Economy (17th Edition)EconomicsISBN:9780134870069Author:William G. Sullivan, Elin M. Wicks, C. Patrick KoellingPublisher:PEARSON
 Principles of Economics (MindTap Course List)EconomicsISBN:9781305585126Author:N. Gregory MankiwPublisher:Cengage Learning
 Managerial Economics: A Problem Solving ApproachEconomicsISBN:9781337106665Author:Luke M. Froeb, Brian T. McCann, Michael R. Ward, Mike ShorPublisher:Cengage Learning
 Managerial Economics & Business Strategy (Mcgraw-...EconomicsISBN:9781259290619Author:Michael Baye, Jeff PrincePublisher:McGraw-Hill Education


