
Videos
More freshmen: For the data in Exercise 6:
- Construct a frequency
polygon . - Construct a relative frequency polygon.
- Construct a frequency ogive.
- Construct a relative frequency ogive.
a.
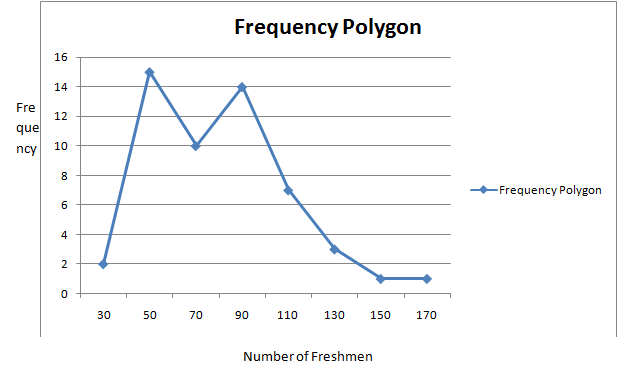
To construct:A frequency polygon.
Explanation of Solution
Given information: The following frequency distribution presents the number of freshmen elected in each of the past 53 elections from 1912 to 2016.
| Number of Freshmen | Frequency |
| 20-39 | 2 |
| 40-59 | 15 |
| 60-79 | 10 |
| 80-99 | 14 |
| 100-119 | 7 |
| 120-139 | 3 |
| 140-159 | 1 |
| 160-179 | 1 |
Formula used:
Calculation:
| Number of Freshmen | Class Midpoints | Frequency |
| 20-39 | 2 | |
| 40-59 | 15 | |
| 60-79 | 10 | |
| 80-99 | 14 | |
| 100-119 | 7 | |
| 120-139 | 3 | |
| 140-159 | 1 | |
| 160-179 | 1 |
Now plotting the points whose x-coordinates are the class midpoints and whose y-coordinates are the frequencies. Then the frequency polygon is connecting the points with straight line
b.
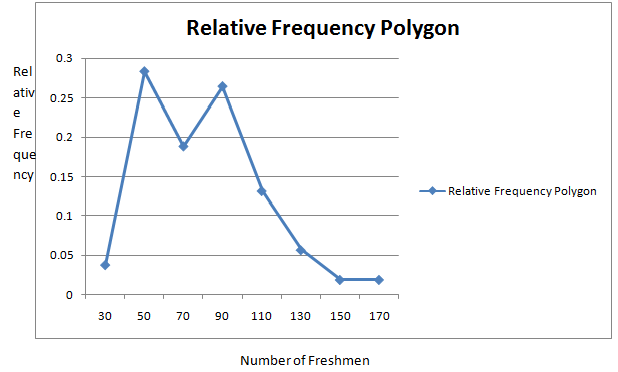
To construct: A relative frequency polygon.
Explanation of Solution
Given information: The following frequency distribution presents the number of freshmen elected in each of the past 53 elections from 1912 to 2016.
| Number of Freshmen | Frequency |
| 20-39 | 2 |
| 40-59 | 15 |
| 60-79 | 10 |
| 80-99 | 14 |
| 100-119 | 7 |
| 120-139 | 3 |
| 140-159 | 1 |
| 160-179 | 1 |
Formula used:
Calculation:
| Number of Freshmen | Class Midpoints | Frequency | Relative Frequency |
| 20-39 | 2 | ||
| 40-59 | 15 | ||
| 60-79 | 10 | ||
| 80-99 | 14 | ||
| 100-119 | 7 | ||
| 120-139 | 3 | ||
| 140-159 | 1 | ||
| 160-179 | 1 |
Now plotting the points whose x-coordinates are the class midpoints and whose y-coordinates are therelative frequencies. Then the relative frequency polygon is connecting the points with straight line.
s
c.
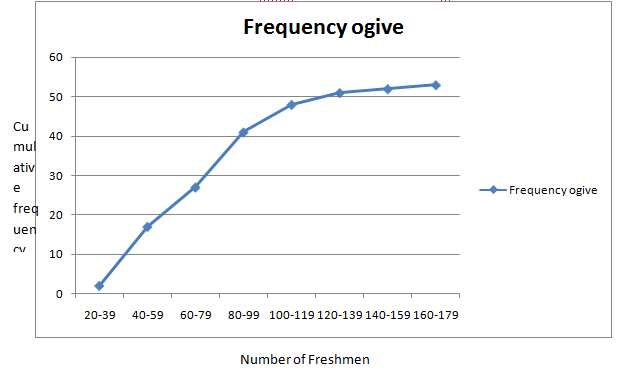
To construct: A frequency ogive.
Explanation of Solution
Given information: The following frequency distribution presents the number of freshmen elected in each of the past 53 elections from 1912 to 2016.
| Number of Freshmen | Frequency |
| 20-39 | 2 |
| 40-59 | 15 |
| 60-79 | 10 |
| 80-99 | 14 |
| 100-119 | 7 |
| 120-139 | 3 |
| 140-159 | 1 |
| 160-179 | 1 |
Definition used: The cumulative frequency of a class is the sum of the frequencies of that class and all previous classes.
Anogive plots the cumulative frequencies.
Calculation:
The cumulative classes are given by in the following table.
| Number of Freshmen | Frequency | Cumulative Frequency |
| 20-39 | 2 | 2 |
| 40-59 | 15 | |
| 60-79 | 10 | |
| 80-99 | 14 | |
| 100-119 | 7 | |
| 120-139 | 3 | |
| 140-159 | 1 | |
| 160-179 | 1 |
The frequency ogive is is given by
d.
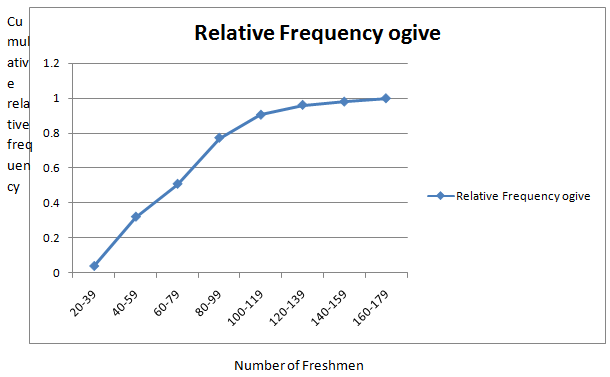
To construct: A relative frequency ogive.
Explanation of Solution
Given information: The following frequency distribution presents the number of freshmen elected in each of the past 53 elections from 1912 to 2016.
| Number of Freshmen | Frequency |
| 20-39 | 2 |
| 40-59 | 15 |
| 60-79 | 10 |
| 80-99 | 14 |
| 100-119 | 7 |
| 120-139 | 3 |
| 140-159 | 1 |
| 160-179 | 1 |
Definition used: The cumulative relative frequency of a class is given by
A relative frequency ogive plots the cumulative relative frequencies.
Calculation:
The cumulative classes are given by in the following table.
| Number of Freshmen | Frequency | Cumulative Frequency | Cumulative relative Frequency |
| 20-39 | 2 | 2 | |
| 40-59 | 15 | ||
| 60-79 | 10 | ||
| 80-99 | 14 | ||
| 100-119 | 7 | ||
| 120-139 | 3 | ||
| 140-159 | 1 | ||
| 160-179 | 1 |
The relative frequency ogive is is given by
Want to see more full solutions like this?
Chapter 2 Solutions
Elementary Statistics (Text Only)


- A company found that the daily sales revenue of its flagship product follows a normal distribution with a mean of $4500 and a standard deviation of $450. The company defines a "high-sales day" that is, any day with sales exceeding $4800. please provide a step by step on how to get the answers in excel Q: What percentage of days can the company expect to have "high-sales days" or sales greater than $4800? Q: What is the sales revenue threshold for the bottom 10% of days? (please note that 10% refers to the probability/area under bell curve towards the lower tail of bell curve) Provide answers in the yellow cellsarrow_forwardFind the critical value for a left-tailed test using the F distribution with a 0.025, degrees of freedom in the numerator=12, and degrees of freedom in the denominator = 50. A portion of the table of critical values of the F-distribution is provided. Click the icon to view the partial table of critical values of the F-distribution. What is the critical value? (Round to two decimal places as needed.)arrow_forwardA retail store manager claims that the average daily sales of the store are $1,500. You aim to test whether the actual average daily sales differ significantly from this claimed value. You can provide your answer by inserting a text box and the answer must include: Null hypothesis, Alternative hypothesis, Show answer (output table/summary table), and Conclusion based on the P value. Showing the calculation is a must. If calculation is missing,so please provide a step by step on the answers Numerical answers in the yellow cellsarrow_forward
 Holt Mcdougal Larson Pre-algebra: Student Edition...AlgebraISBN:9780547587776Author:HOLT MCDOUGALPublisher:HOLT MCDOUGAL
 Glencoe Algebra 1, Student Edition, 9780079039897...AlgebraISBN:9780079039897Author:CarterPublisher:McGraw Hill
 Big Ideas Math A Bridge To Success Algebra 1: Stu...AlgebraISBN:9781680331141Author:HOUGHTON MIFFLIN HARCOURTPublisher:Houghton Mifflin Harcourt
 Functions and Change: A Modeling Approach to Coll...AlgebraISBN:9781337111348Author:Bruce Crauder, Benny Evans, Alan NoellPublisher:Cengage Learning