Pearson eText Introductory Statistics: Exploring the World Through Data -- Instant Access (Pearson+)
3rd Edition
ISBN: 9780136880882
Author: Robert Gould, Rebecca Wong
Publisher: PEARSON+
bartleby

Videos

Textbook Question
Book Icon
Chapter 2, Problem 71CRE

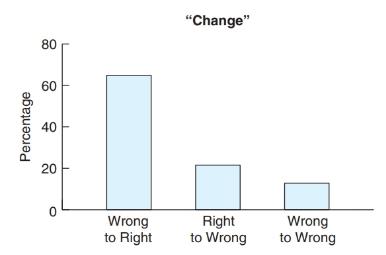
Changing Multiple-Choice Answers When Told to Do So One of the authors wanted to determine the effect of changing answers on multiple-choice tests. She had advised her students that if they had changed their minds about a previous answer, they should replace their first choice with their new choice. By looking for erasures on the exam, she was able to count the number of changed answers that went from wrong to right, from right to wrong, and from wrong to wrong. The results are shown in the bar chart.

a. Do the data support her view that it is better to replace your initial choice with the revised choice?

b. Compare this bar chart with the one in Exercise 2.37. Does changing answers generally tend to lead to higher or to lower grades?

Chapter 2, Problem 71CRE, Changing Multiple-Choice Answers When Told to Do So One of the authors wanted to determine the

Blurred answer
Students have asked these similar questions
Prove that 1) | RxX (T) | << = (R₁ " + R$) 2) find Laplalse trans. of Normal dis: 3) Prove thy t /Rx (z) | < | Rx (0)\ 4) show that evary algebra is algebra or not.
For each of the time​ series, construct a line chart of the data and identify the characteristics of the time series​ (that is,​ random, stationary,​ trend, seasonal, or​ cyclical). Month    Number (Thousands)Dec 1991    65.60Jan 1992    71.60Feb 1992    78.80Mar 1992    111.60Apr 1992    107.60May 1992    115.20Jun 1992    117.80Jul 1992    106.20Aug 1992    109.90Sep 1992    106.00Oct 1992    111.80Nov 1992    84.50Dec 1992    78.60Jan 1993    70.50Feb 1993    74.60Mar 1993    95.50Apr 1993    117.80May 1993    120.90Jun 1993    128.50Jul 1993    115.30Aug 1993    121.80Sep 1993    118.50Oct 1993    123.30Nov 1993    102.30Dec 1993    98.70Jan 1994    76.20Feb 1994    83.50Mar 1994    134.30Apr 1994    137.60May 1994    148.80Jun 1994    136.40Jul 1994    127.80Aug 1994    139.80Sep 1994    130.10Oct 1994    130.60Nov 1994    113.40Dec 1994    98.50Jan 1995    84.50Feb 1995    81.60Mar 1995    103.80Apr 1995    116.90May 1995    130.50Jun 1995    123.40Jul 1995    129.10Aug 1995…
For each of the time​ series, construct a line chart of the data and identify the characteristics of the time series​ (that is,​ random, stationary,​ trend, seasonal, or​ cyclical). Year    Month    Units1    Nov    42,1611    Dec    44,1862    Jan    42,2272    Feb    45,4222    Mar    54,0752    Apr    50,9262    May    53,5722    Jun    54,9202    Jul    54,4492    Aug    56,0792    Sep    52,1772    Oct    50,0872    Nov    48,5132    Dec    49,2783    Jan    48,1343    Feb    54,8873    Mar    61,0643    Apr    53,3503    May    59,4673    Jun    59,3703    Jul    55,0883    Aug    59,3493    Sep    54,4723    Oct    53,164

Chapter 2 Solutions

Pearson eText Introductory Statistics: Exploring the World Through Data -- Instant Access (Pearson+)

Ch. 2 - Arm spans (Example 3) According to the ancient...Ch. 2 - Tuition The distribution of in-state annual...Ch. 2 - Pulse Rates (Example 4) From the histogram in...Ch. 2 - Fast Food Calories From the histogram shown in...Ch. 2 - BMI (Example 5) The histograms show the Body Mass...Ch. 2 - Triglycerides The histograms show triglyceride...Ch. 2 - Education (Example 6) In 2012, the General Social...Ch. 2 - Siblings The histogram shows the distribution of...Ch. 2 - Monthly Car Costs The histograms show the monthly...Ch. 2 - Car MPG The histograms show the miles per gallon...Ch. 2 - Matching Histograms Match each of the three...Ch. 2 - Matching Match each histogram given with the...Ch. 2 - Matching Match each description with the correct...Ch. 2 - Matching Match each description with the correct...Ch. 2 - Comparing Weights of Olympic Hockey and Soccer...Ch. 2 - Rents in San Francisco The data show monthly rents...Ch. 2 - Textbook Prices The table shows prices of 50...Ch. 2 - SAT scores The following table shows a random...Ch. 2 - Animal Longevity The following table in Exercise...Ch. 2 - Animal Gestation Periods The accompanying table...Ch. 2 - Tax Rate A StatCrunch survey asked people what...Ch. 2 - Pets A StatCrunch survey asked people whether they...Ch. 2 - Law School Tuition Data are shown for the cost of...Ch. 2 - Text Messages Recently, 115 users of StatCrunch...Ch. 2 - Beer, Calories Data are available on the number of...Ch. 2 - Beer, Alcohol Data are available on the percent...Ch. 2 - Changing Multiple-Choice Answers When Told Not to...Ch. 2 - Preventable Deaths According to the World Health...Ch. 2 - Ice Cream Preference (Example 8) Suppose a group...Ch. 2 - Prob. 40SECh. 2 - Gun Availability Pew Research conducted a survey...Ch. 2 - Entry-Level Education The Bureau of Labor...Ch. 2 - Obesity Among Adults (Example 9) Data on obesity...Ch. 2 - Fitness Among Adults Data on the percentage of...Ch. 2 - Internet Browsers The following table gives the...Ch. 2 - Commercial Radio The following table gives the...Ch. 2 - Garage The accompanying graph shows the...Ch. 2 - Body Image A student has gathered data on...Ch. 2 - Pie Chart of Sleep Hours The pie chart reports the...Ch. 2 - Age and Gender The following graph shows the ages...Ch. 2 - Musicians Survey: StatCrunch Graph The...Ch. 2 - Cell Phone Use Refer to the accompanying bar...Ch. 2 - Sleep The following table shows the first few...Ch. 2 - Majors The following table shows the first few...Ch. 2 - Hormone Replacement Therapy The use of the drug...Ch. 2 - E-Music The bar graph shows information reported...Ch. 2 - Hormone Replacement Therapy Again The following...Ch. 2 - Holding Your Breath A group of students held their...Ch. 2 - Global Temperatures The histograms show the...Ch. 2 - Employment after Law School Accredited law schools...Ch. 2 - Opinions on Nuclear Energy People were asked...Ch. 2 - Stem Cell Research People were asked whether they...Ch. 2 - Create a dotplot that has at least 10 observations...Ch. 2 - Create a dotplot that has at least 10 observations...Ch. 2 - Traffic Cameras College students Jeannette Mujica,...Ch. 2 - Ideal Weight Thirty-nine students (26 women and 13...Ch. 2 - MPH The graphs show the distribution of...Ch. 2 - Shoe Sizes The graph shows shoe sizes for men and...Ch. 2 - CEO Salaries Predict the shape of the distribution...Ch. 2 - Cigarettes A physician asks all of his patients to...Ch. 2 - Changing Multiple-Choice Answers When Told to Do...Ch. 2 - ER Visits for Injuries The graph shows the rates...Ch. 2 - Social Media Use The Pew Research Center documents...Ch. 2 - Social Media Use The Pew Research Center gathered...Ch. 2 - Choosing a Graph For each situation, describe the...Ch. 2 - Choosing a Graph For each situation, describe the...

Additional Math Textbook Solutions

Find more solutions based on key concepts
1. How is a sample related to a population?

Elementary Statistics: Picturing the World (7th Edition)

Reading, Writing, and Rounding Whole Numbers Write in words. 357

Mathematics for the Trades: A Guided Approach (11th Edition) (What's New in Trade Math)

Evaluate the integrals in Exercises 1–46. 1.

University Calculus: Early Transcendentals (4th Edition)

Knowledge Booster
Background pattern image
Statistics
Learn more about
Need a deep-dive on the concept behind this application? Look no further. Learn more about this topic, statistics and related others by exploring similar questions and additional content below.
Similar questions
SEE MORE QUESTIONS
Recommended textbooks for you
Text book image
Glencoe Algebra 1, Student Edition, 9780079039897...
Algebra
ISBN:9780079039897
Author:Carter
Publisher:McGraw Hill
Text book image
Big Ideas Math A Bridge To Success Algebra 1: Stu...
Algebra
ISBN:9781680331141
Author:HOUGHTON MIFFLIN HARCOURT
Publisher:Houghton Mifflin Harcourt
Text book image
Algebra: Structure And Method, Book 1
Algebra
ISBN:9780395977224
Author:Richard G. Brown, Mary P. Dolciani, Robert H. Sorgenfrey, William L. Cole
Publisher:McDougal Littell
Text book image
Holt Mcdougal Larson Pre-algebra: Student Edition...
Algebra
ISBN:9780547587776
Author:HOLT MCDOUGAL
Publisher:HOLT MCDOUGAL
Hypothesis Testing using Confidence Interval Approach; Author: BUM2413 Applied Statistics UMP;https://www.youtube.com/watch?v=Hq1l3e9pLyY;License: Standard YouTube License, CC-BY
Hypothesis Testing - Difference of Two Means - Student's -Distribution & Normal Distribution; Author: The Organic Chemistry Tutor;https://www.youtube.com/watch?v=UcZwyzwWU7o;License: Standard Youtube License