
Intro Stats, Books a la Carte Edition (5th Edition)
5th Edition
ISBN: 9780134210285
Author: Richard D. De Veaux, Paul Velleman, David E. Bock
Publisher: PEARSON
expand_more
expand_more
format_list_bulleted
Concept explainers
Videos
Textbook Question
Chapter 2, Problem 59E
Pizza prices The histogram shows the distribution of the prices of plain pizza slices (in $) for 156 weeks in Dallas, TX.
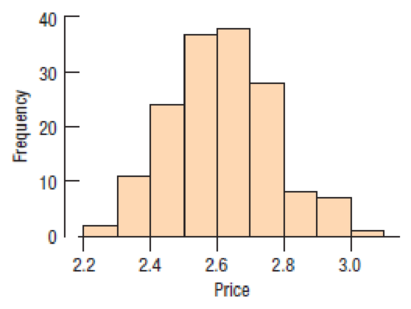
Which summary statistics would you choose to summarize the center and spread in these data? Why?
Expert Solution & Answer
Want to see the full answer?
Check out a sample textbook solution
Students have asked these similar questions
2. An experiment is set up to test the effectiveness of a new drug for balancing
people's mood. The table below contains the results of the patients before and
after taking the drug. The possible scores are the integers from 0 to 10, where
0 indicates a depressed mood and 10 indicates and elated mood.
Patient Before
After
1
4
4
2
3
3
3
6
4
4
1
2
5
6
5
6
1
3
7
4
7
8
6
9
1
4
10
5
4
Assuming the differences of the observations to be symmetric, but not normally
distributed, investigate the effectiveness of the drug at the 5% significance level.
[4 Marks]
3. (i) Consider the following R code:
wilcox.test(UK Supermarkets $Salary ~ UKSupermarkets $Supermarket)
(a) Which test is being used in this code?
(b) What is the name of the dataset under consideration?
How would be adapt this code if we had ties? What other command
can be used which deals with ties?
(ii) Consider the following R code:
install packages("nortest")
library(nortest)
lillie.test (Differences)
(a) Assuming the appropriate dataset has been imported and attached,
what is wrong with this code?
(b) If this code were to be corrected, what would be determined by run-
ning it?
[3 Marks]
1. (i) Explain the difference in application between the Mann-Whitney U test
and the Wilcoxon Signed-Rank test, i.e. in which scenarios would each test be
used?
(ii) What is the main procedure underlying these nonparametric tests?
[3 Marks]
Chapter 2 Solutions
Intro Stats, Books a la Carte Edition (5th Edition)
Ch. 2.3 - You may be surprised to find that you already have...Ch. 2.3 - You may be surprised to find that you already have...Ch. 2.3 - You may be surprised to find that you already have...Ch. 2.3 - Prob. 4JCCh. 2.3 - Prob. 5JCCh. 2.5 - The U.S. Census Bureau reports the median family...Ch. 2.5 - Prob. 7JCCh. 2.5 - Prob. 8JCCh. 2 - SECTION 2.1 1. Automobile fatalities The table...Ch. 2 - Nonoccupant fatalities The frequencies of traffic...
Ch. 2 - Prob. 3ECh. 2 - Movie ratings The Motion Picture Association of...Ch. 2 - Prob. 5ECh. 2 - Marriage in decline Changing attitudes about...Ch. 2 - Traffic fatalities 2013 Here are two histograms...Ch. 2 - Prob. 8ECh. 2 - Prob. 9ECh. 2 - Prob. 10ECh. 2 - E-mails A university teacher saved every e-mail...Ch. 2 - Adoptions The U.S. Census Bureau keeps track of...Ch. 2 - Biceps revisited Describe the shape of the...Ch. 2 - E-mails II For the distribution of e-mails sent by...Ch. 2 - Life expectancy Here are the life expectancies at...Ch. 2 - Prob. 16ECh. 2 - Life expectancy II For the 146 life expectancies...Ch. 2 - Adoptions II For the number of adoptions in...Ch. 2 - How big is your bicep II? For the bicep...Ch. 2 - Shoe sizes II For the shoe sizes in Exercise 16,...Ch. 2 - SECTION 2.5 21. Life expectancy III For the 190...Ch. 2 - Prob. 22ECh. 2 - How big is your bicep III? For the bicep...Ch. 2 - Prob. 24ECh. 2 - Thinking about shape Would you expect...Ch. 2 - More shapes Would you expect distributions of...Ch. 2 - Movie genres again Here is a bar chart summarizing...Ch. 2 - Prob. 36ECh. 2 - Prob. 37ECh. 2 - Prob. 38ECh. 2 - Prob. 39ECh. 2 - Prob. 40ECh. 2 - Prob. 41ECh. 2 - Prob. 42ECh. 2 - Prob. 43ECh. 2 - Modalities A survey of athletic trainers asked...Ch. 2 - Cereals The histogram shows the carbohydrate...Ch. 2 - Run times One of the authors collected the times...Ch. 2 - Heart attack stays The histogram shows the lengths...Ch. 2 - Bird species 2013 The Cornell Lab of Ornithology...Ch. 2 - Super Bowl points 2016 How many points do football...Ch. 2 - Prob. 50ECh. 2 - Test scores, large class Test scores from a large...Ch. 2 - Prob. 52ECh. 2 - Mistake A clerk entering salary data into a...Ch. 2 - Sick days During contract negotiations, a company...Ch. 2 - Prob. 55ECh. 2 - Tornadoes 2015 Here are the annual numbers of...Ch. 2 - Prob. 57ECh. 2 - Tornadoes 2015 II Using the data from Exercise 56,...Ch. 2 - Pizza prices The histogram shows the distribution...Ch. 2 - Neck size The histogram shows the neck sizes (in...Ch. 2 - Pizza prices again Look again at the histogram of...Ch. 2 - Neck sizes again Look again at the histogram of...Ch. 2 - Movie lengths 2010 The histogram shows the running...Ch. 2 - Golf drives 2015 The display shows the average...Ch. 2 - Prob. 65ECh. 2 - Golf drives II 2015 Exercise 64 looked at...Ch. 2 - Prob. 67ECh. 2 - Cold weather A meteorologist preparing a talk...Ch. 2 - Gasoline 2014 In January 2014, 16 gas stations in...Ch. 2 - The great one During his 20 seasons in the NHL,...Ch. 2 - Prob. 71ECh. 2 - Prob. 72ECh. 2 - Prob. 73ECh. 2 - Prob. 74ECh. 2 - Prob. 75ECh. 2 - Prob. 76ECh. 2 - Acid rain Two researchers measured the pH (a scale...Ch. 2 - Marijuana 2015 In 2015 the Council of Europe...Ch. 2 - Prob. 79ECh. 2 - Prob. 80ECh. 2 - Prob. 81ECh. 2 - ZIP codes revisited Here are some summary...Ch. 2 - Prob. 83ECh. 2 - Prob. 84ECh. 2 - Prob. 85E
Additional Math Textbook Solutions
Find more solutions based on key concepts
Provide an example of a qualitative variable and an example of a quantitative variable.
Elementary Statistics ( 3rd International Edition ) Isbn:9781260092561
1. How is a sample related to a population?
Elementary Statistics: Picturing the World (7th Edition)
Empirical versus Theoretical A Monopoly player claims that the probability of getting a 4 when rolling a six-si...
Introductory Statistics
Silvia wants to mix a 40% apple juice drink with pure apple juice to make 2 L of a juice drink that is 80% appl...
Beginning and Intermediate Algebra
23. A plant nursery sells two sizes of oak trees to landscapers. Large trees cost the nursery $120 from the gro...
College Algebra (Collegiate Math)
Knowledge Booster


Learn more about
Need a deep-dive on the concept behind this application? Look no further. Learn more about this topic, statistics and related others by exploring similar questions and additional content below.Similar questions
- You may need to use the appropriate appendix table or technology to answer this question. You are given the following information obtained from a random sample of 4 observations. 24 48 31 57 You want to determine whether or not the mean of the population from which this sample was taken is significantly different from 49. (Assume the population is normally distributed.) (a) State the null and the alternative hypotheses. (Enter != for ≠ as needed.) H0: Ha: (b) Determine the test statistic. (Round your answer to three decimal places.) (c) Determine the p-value, and at the 5% level of significance, test to determine whether or not the mean of the population is significantly different from 49. Find the p-value. (Round your answer to four decimal places.) p-value = State your conclusion. Reject H0. There is insufficient evidence to conclude that the mean of the population is different from 49.Do not reject H0. There is sufficient evidence to conclude that the…arrow_forward65% of all violent felons in the prison system are repeat offenders. If 43 violent felons are randomly selected, find the probability that a. Exactly 28 of them are repeat offenders. b. At most 28 of them are repeat offenders. c. At least 28 of them are repeat offenders. d. Between 22 and 26 (including 22 and 26) of them are repeat offenders.arrow_forward08:34 ◄ Classroom 07:59 Probs. 5-32/33 D ا. 89 5-34. Determine the horizontal and vertical components of reaction at the pin A and the normal force at the smooth peg B on the member. A 0,4 m 0.4 m Prob. 5-34 F=600 N fr th ar 0. 163586 5-37. The wooden plank resting between the buildings deflects slightly when it supports the 50-kg boy. This deflection causes a triangular distribution of load at its ends. having maximum intensities of w, and wg. Determine w and wg. each measured in N/m. when the boy is standing 3 m from one end as shown. Neglect the mass of the plank. 0.45 m 3 marrow_forward
- Examine the Variables: Carefully review and note the names of all variables in the dataset. Examples of these variables include: Mileage (mpg) Number of Cylinders (cyl) Displacement (disp) Horsepower (hp) Research: Google to understand these variables. Statistical Analysis: Select mpg variable, and perform the following statistical tests. Once you are done with these tests using mpg variable, repeat the same with hp Mean Median First Quartile (Q1) Second Quartile (Q2) Third Quartile (Q3) Fourth Quartile (Q4) 10th Percentile 70th Percentile Skewness Kurtosis Document Your Results: In RStudio: Before running each statistical test, provide a heading in the format shown at the bottom. “# Mean of mileage – Your name’s command” In Microsoft Word: Once you've completed all tests, take a screenshot of your results in RStudio and paste it into a Microsoft Word document. Make sure that snapshots are very clear. You will need multiple snapshots. Also transfer these results to the…arrow_forwardExamine the Variables: Carefully review and note the names of all variables in the dataset. Examples of these variables include: Mileage (mpg) Number of Cylinders (cyl) Displacement (disp) Horsepower (hp) Research: Google to understand these variables. Statistical Analysis: Select mpg variable, and perform the following statistical tests. Once you are done with these tests using mpg variable, repeat the same with hp Mean Median First Quartile (Q1) Second Quartile (Q2) Third Quartile (Q3) Fourth Quartile (Q4) 10th Percentile 70th Percentile Skewness Kurtosis Document Your Results: In RStudio: Before running each statistical test, provide a heading in the format shown at the bottom. “# Mean of mileage – Your name’s command” In Microsoft Word: Once you've completed all tests, take a screenshot of your results in RStudio and paste it into a Microsoft Word document. Make sure that snapshots are very clear. You will need multiple snapshots. Also transfer these results to the…arrow_forwardExamine the Variables: Carefully review and note the names of all variables in the dataset. Examples of these variables include: Mileage (mpg) Number of Cylinders (cyl) Displacement (disp) Horsepower (hp) Research: Google to understand these variables. Statistical Analysis: Select mpg variable, and perform the following statistical tests. Once you are done with these tests using mpg variable, repeat the same with hp Mean Median First Quartile (Q1) Second Quartile (Q2) Third Quartile (Q3) Fourth Quartile (Q4) 10th Percentile 70th Percentile Skewness Kurtosis Document Your Results: In RStudio: Before running each statistical test, provide a heading in the format shown at the bottom. “# Mean of mileage – Your name’s command” In Microsoft Word: Once you've completed all tests, take a screenshot of your results in RStudio and paste it into a Microsoft Word document. Make sure that snapshots are very clear. You will need multiple snapshots. Also transfer these results to the…arrow_forward
- 2 (VaR and ES) Suppose X1 are independent. Prove that ~ Unif[-0.5, 0.5] and X2 VaRa (X1X2) < VaRa(X1) + VaRa (X2). ~ Unif[-0.5, 0.5]arrow_forward8 (Correlation and Diversification) Assume we have two stocks, A and B, show that a particular combination of the two stocks produce a risk-free portfolio when the correlation between the return of A and B is -1.arrow_forward9 (Portfolio allocation) Suppose R₁ and R2 are returns of 2 assets and with expected return and variance respectively r₁ and 72 and variance-covariance σ2, 0%½ and σ12. Find −∞ ≤ w ≤ ∞ such that the portfolio wR₁ + (1 - w) R₂ has the smallest risk.arrow_forward
- 7 (Multivariate random variable) Suppose X, €1, €2, €3 are IID N(0, 1) and Y2 Y₁ = 0.2 0.8X + €1, Y₂ = 0.3 +0.7X+ €2, Y3 = 0.2 + 0.9X + €3. = (In models like this, X is called the common factors of Y₁, Y₂, Y3.) Y = (Y1, Y2, Y3). (a) Find E(Y) and cov(Y). (b) What can you observe from cov(Y). Writearrow_forward1 (VaR and ES) Suppose X ~ f(x) with 1+x, if 0> x > −1 f(x) = 1−x if 1 x > 0 Find VaRo.05 (X) and ES0.05 (X).arrow_forwardJoy is making Christmas gifts. She has 6 1/12 feet of yarn and will need 4 1/4 to complete our project. How much yarn will she have left over compute this solution in two different ways arrow_forward
arrow_back_ios
SEE MORE QUESTIONS
arrow_forward_ios
Recommended textbooks for you
 Holt Mcdougal Larson Pre-algebra: Student Edition...AlgebraISBN:9780547587776Author:HOLT MCDOUGALPublisher:HOLT MCDOUGAL
 Big Ideas Math A Bridge To Success Algebra 1: Stu...AlgebraISBN:9781680331141Author:HOUGHTON MIFFLIN HARCOURTPublisher:Houghton Mifflin Harcourt
 Glencoe Algebra 1, Student Edition, 9780079039897...AlgebraISBN:9780079039897Author:CarterPublisher:McGraw Hill
Holt Mcdougal Larson Pre-algebra: Student Edition...
Algebra
ISBN:9780547587776
Author:HOLT MCDOUGAL
Publisher:HOLT MCDOUGAL
Big Ideas Math A Bridge To Success Algebra 1: Stu...
Algebra
ISBN:9781680331141
Author:HOUGHTON MIFFLIN HARCOURT
Publisher:Houghton Mifflin Harcourt
Glencoe Algebra 1, Student Edition, 9780079039897...
Algebra
ISBN:9780079039897
Author:Carter
Publisher:McGraw Hill
The Shape of Data: Distributions: Crash Course Statistics #7; Author: CrashCourse;https://www.youtube.com/watch?v=bPFNxD3Yg6U;License: Standard YouTube License, CC-BY
Shape, Center, and Spread - Module 20.2 (Part 1); Author: Mrmathblog;https://www.youtube.com/watch?v=COaid7O_Gag;License: Standard YouTube License, CC-BY
Shape, Center and Spread; Author: Emily Murdock;https://www.youtube.com/watch?v=_YyW0DSCzpM;License: Standard Youtube License