
Basic Business Statistics
14th Edition
ISBN: 9780134684840
Author: BERENSON, Mark L., Levine, David M., Szabat, Kathryn A.
Publisher: Pearson,
expand_more
expand_more
format_list_bulleted
Concept explainers
Videos
Textbook Question
Chapter 2, Problem 45PS
The financial service call center in problem 2.44 also monitors call duration, which is the amount of time speaking to customer to the phone. The file callDuration contains the following data for time, in seconds spent by agent talking to 50 customers.
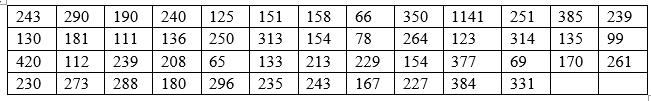
a. Construct a percentage histogram and a percentage
b. Construct a cumulative percentage polygon.
c. What can you conclude about call center performance if a call duration target of less than 240 seconds is set?
Expert Solution & Answer
Want to see the full answer?
Check out a sample textbook solution
Students have asked these similar questions
Question 2: When John started his first job, his first end-of-year salary was $82,500. In the following years, he received salary raises as shown in the following table.
Fill the Table: Fill the following table showing his end-of-year salary for each year. I have already provided the end-of-year salaries for the first three years. Calculate the end-of-year salaries for the remaining years using Excel. (If you Excel answer for the top 3 cells is not the same as the one in the following table, your formula / approach is incorrect) (2 points)
Geometric Mean of Salary Raises: Calculate the geometric mean of the salary raises using the percentage figures provided in the second column named “% Raise”. (The geometric mean for this calculation should be nearly identical to the arithmetic mean. If your answer deviates significantly from the mean, it's likely incorrect. 2 points)
Starting salary
% Raise
Raise
Salary after raise
75000
10%
7500
82500
82500
4%
3300…
I need help with this problem and an explanation of the solution for the image described below. (Statistics: Engineering Probabilities)
I need help with this problem and an explanation of the solution for the image described below. (Statistics: Engineering Probabilities)
Chapter 2 Solutions
Basic Business Statistics
Ch. 2 - A categorical variable has three categories, with...Ch. 2 - The following data represent the responses to two...Ch. 2 - The following table, stored in Smartphones Sales,...Ch. 2 - The Consumer Financial Protection Bureau reports...Ch. 2 - In addition to the impact of Big Data, what...Ch. 2 - This table represents the summer power-generating...Ch. 2 - Timetric’s 2016 survey of insurance...Ch. 2 - A survey of 1,520 Americans adults asked “Do you...Ch. 2 - A study of selected Kickstarter projects showed...Ch. 2 - Do special recommendations increase ad...
Ch. 2 - Construct an ordered array, given the following...Ch. 2 - Construct an ordered array, given the following...Ch. 2 - Planning and preparing for the unexpected,...Ch. 2 - Data was collected on salaries of compliance...Ch. 2 - The file NBACost contains the total cost ($ ) for...Ch. 2 - The file Utility contains the following data about...Ch. 2 - How much time do commuters living in or near...Ch. 2 - How do the average credit scores of people living...Ch. 2 - One operation of a mill is to cut pieces of steel...Ch. 2 - Call centers today play an important role in...Ch. 2 - The financial service call centre in problem 2.20...Ch. 2 - The file Bulbs contains the life (in hours) of a...Ch. 2 - The file Drink Contains the following data for the...Ch. 2 - A survey of online shoppers revealed that in 2015...Ch. 2 - How do college students spend their day? The 2016...Ch. 2 - The Energy Information Administration reported the...Ch. 2 - The Consumer Financial Protection Bureau reports...Ch. 2 - The following table indicates the percentage of...Ch. 2 - Timetric’s 2016 survey of insurance...Ch. 2 - A survey of 1,520 American adults asked “Do you...Ch. 2 - A study of selected Kickstarter projects showed...Ch. 2 - Do special recommendations increase ad...Ch. 2 - Construct a stern-and-leaf display, given the...Ch. 2 - Construct an ordered array, given the following...Ch. 2 - The following is a stern-and0-leaf display...Ch. 2 - The file NBACost contains the total cost in$ for...Ch. 2 - The file MobileSpeed contains the overall download...Ch. 2 - The file Utility contains the following data about...Ch. 2 - As player salaries have increases, the cost of...Ch. 2 - The following histogram and cumulative percentage...Ch. 2 - How much time do Americans living in cities spend...Ch. 2 - How do the average credit scores of people living...Ch. 2 - One operation of a mill is to cut pieces of steel...Ch. 2 - Call centers today play an important role in...Ch. 2 - The financial service call center in problem 2.44...Ch. 2 - The file Bulbs contains the life (in hours) of a...Ch. 2 - The data stored in Drink represents the amount of...Ch. 2 - The following is a set of data from a sample of...Ch. 2 - The following is a series of annual sales...Ch. 2 - Movie companies need to predict the gross receipts...Ch. 2 - Data were collected on the typical cost of dining...Ch. 2 - The file Mobile contains the overall download and...Ch. 2 - A Pew Research Center survey found a noticeable...Ch. 2 - How have stocks performed in the past? The...Ch. 2 - The file NewHomeSales contains the number of new...Ch. 2 - The file Movie Attendance 16 contains the yearly...Ch. 2 - The Super Bowl is a big viewing event watched by...Ch. 2 - Using the sample of retirement funds stored in...Ch. 2 - Using the sample of retirement funds stored in...Ch. 2 - Prob. 60PSCh. 2 - Using the sample of retirement funds stored in...Ch. 2 - Prob. 62PSCh. 2 - Using the sample of retirement funds stored in...Ch. 2 - Prob. 64PSCh. 2 - Using the sample of retirement funds stored in...Ch. 2 - Prob. 66PSCh. 2 - Prob. 67PSCh. 2 - Prob. 68PSCh. 2 - Prob. 71PSCh. 2 - Prob. 72PSCh. 2 - Examine the following visualization, adapted from...Ch. 2 - Prob. 75PSCh. 2 - Prob. 76PSCh. 2 - How do histograms and polygons differ in...Ch. 2 - Why would you construct a summary table?Ch. 2 - What are the advantages and disadvantage of using...Ch. 2 - Compare and contrast the bar chart for categorical...Ch. 2 - What is the difference between a time-series plot...Ch. 2 - Why is it said that the main feature of a Pareto...Ch. 2 - What are the three different ways to break down...Ch. 2 - How can a multidimensional table differ from a...Ch. 2 - What type of insights can you gain from a...Ch. 2 - Prob. 86PSCh. 2 - What is the difference between a time-series plot...Ch. 2 - The following table shown in the TextbookCosts...Ch. 2 - The following table represents the market share...Ch. 2 - B2B marketers in North America were surveyed about...Ch. 2 - The owner of a restaurant that services...Ch. 2 - Suppose that the owner of the restaurant in...Ch. 2 - The following data represents the pounds per...Ch. 2 - The Air Travel Consumer Report, a monthly product...Ch. 2 - One of the major measures of the quality of...Ch. 2 - The file DomesticBeer Contains the percentage...Ch. 2 - Prob. 97PSCh. 2 - The file CDRate contains the yields for one-year...Ch. 2 - The file CEO 2016 includes the total compensation...Ch. 2 - Prob. 100PSCh. 2 - What was the average price of a room at two-star,...Ch. 2 - The file Protein contains calorie and cholesterol...Ch. 2 - The file Natural Gas contains the U.S. monthly...Ch. 2 - The data stored in Drink represent the amount of...Ch. 2 - Prob. 105PSCh. 2 - A/B testing allows business to test a new design...Ch. 2 - Referring to the results from Problem 2.100 on...
Knowledge Booster


Learn more about
Need a deep-dive on the concept behind this application? Look no further. Learn more about this topic, statistics and related others by exploring similar questions and additional content below.Similar questions
- 310015 K Question 9, 5.2.28-T Part 1 of 4 HW Score: 85.96%, 49 of 57 points Points: 1 Save of 6 Based on a poll, among adults who regret getting tattoos, 28% say that they were too young when they got their tattoos. Assume that six adults who regret getting tattoos are randomly selected, and find the indicated probability. Complete parts (a) through (d) below. a. Find the probability that none of the selected adults say that they were too young to get tattoos. 0.0520 (Round to four decimal places as needed.) Clear all Final check Feb 7 12:47 US Oarrow_forwardhow could the bar graph have been organized differently to make it easier to compare opinion changes within political partiesarrow_forwardDraw a picture of a normal distribution with mean 70 and standard deviation 5.arrow_forward
- What do you guess are the standard deviations of the two distributions in the previous example problem?arrow_forwardPlease answer the questionsarrow_forward30. An individual who has automobile insurance from a certain company is randomly selected. Let Y be the num- ber of moving violations for which the individual was cited during the last 3 years. The pmf of Y isy | 1 2 4 8 16p(y) | .05 .10 .35 .40 .10 a.Compute E(Y).b. Suppose an individual with Y violations incurs a surcharge of $100Y^2. Calculate the expected amount of the surcharge.arrow_forward
- 24. An insurance company offers its policyholders a num- ber of different premium payment options. For a ran- domly selected policyholder, let X = the number of months between successive payments. The cdf of X is as follows: F(x)=0.00 : x < 10.30 : 1≤x<30.40 : 3≤ x < 40.45 : 4≤ x <60.60 : 6≤ x < 121.00 : 12≤ x a. What is the pmf of X?b. Using just the cdf, compute P(3≤ X ≤6) and P(4≤ X).arrow_forward59. At a certain gas station, 40% of the customers use regular gas (A1), 35% use plus gas (A2), and 25% use premium (A3). Of those customers using regular gas, only 30% fill their tanks (event B). Of those customers using plus, 60% fill their tanks, whereas of those using premium, 50% fill their tanks.a. What is the probability that the next customer will request plus gas and fill the tank (A2 B)?b. What is the probability that the next customer fills the tank?c. If the next customer fills the tank, what is the probability that regular gas is requested? Plus? Premium?arrow_forward38. Possible values of X, the number of components in a system submitted for repair that must be replaced, are 1, 2, 3, and 4 with corresponding probabilities .15, .35, .35, and .15, respectively. a. Calculate E(X) and then E(5 - X).b. Would the repair facility be better off charging a flat fee of $75 or else the amount $[150/(5 - X)]? [Note: It is not generally true that E(c/Y) = c/E(Y).]arrow_forward
- 74. The proportions of blood phenotypes in the U.S. popula- tion are as follows:A B AB O .40 .11 .04 .45 Assuming that the phenotypes of two randomly selected individuals are independent of one another, what is the probability that both phenotypes are O? What is the probability that the phenotypes of two randomly selected individuals match?arrow_forward53. A certain shop repairs both audio and video compo- nents. Let A denote the event that the next component brought in for repair is an audio component, and let B be the event that the next component is a compact disc player (so the event B is contained in A). Suppose that P(A) = .6 and P(B) = .05. What is P(BA)?arrow_forward26. A certain system can experience three different types of defects. Let A;(i = 1,2,3) denote the event that the sys- tem has a defect of type i. Suppose thatP(A1) = .12 P(A) = .07 P(A) = .05P(A, U A2) = .13P(A, U A3) = .14P(A2 U A3) = .10P(A, A2 A3) = .011Rshelfa. What is the probability that the system does not havea type 1 defect?b. What is the probability that the system has both type 1 and type 2 defects?c. What is the probability that the system has both type 1 and type 2 defects but not a type 3 defect? d. What is the probability that the system has at most two of these defects?arrow_forward
arrow_back_ios
SEE MORE QUESTIONS
arrow_forward_ios
Recommended textbooks for you
 Glencoe Algebra 1, Student Edition, 9780079039897...AlgebraISBN:9780079039897Author:CarterPublisher:McGraw Hill
Glencoe Algebra 1, Student Edition, 9780079039897...
Algebra
ISBN:9780079039897
Author:Carter
Publisher:McGraw Hill
The Shape of Data: Distributions: Crash Course Statistics #7; Author: CrashCourse;https://www.youtube.com/watch?v=bPFNxD3Yg6U;License: Standard YouTube License, CC-BY
Shape, Center, and Spread - Module 20.2 (Part 1); Author: Mrmathblog;https://www.youtube.com/watch?v=COaid7O_Gag;License: Standard YouTube License, CC-BY
Shape, Center and Spread; Author: Emily Murdock;https://www.youtube.com/watch?v=_YyW0DSCzpM;License: Standard Youtube License